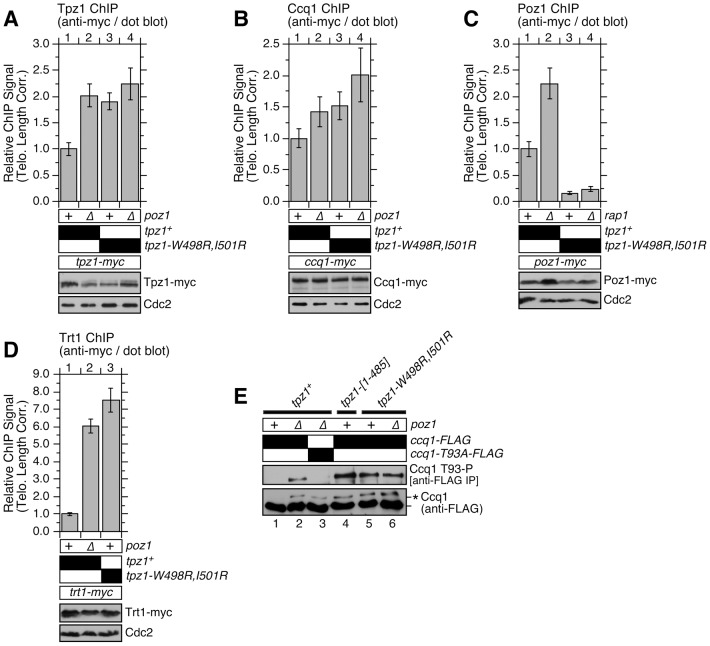
Figure 7. Telomere association of Tpz1, Ccq1, Poz1 and Trt1TERT in Tpz1-Poz1 interaction mutant cells.
Effects of disrupting Tpz1-Poz1 interaction on telomere association for (A) Tpz1, (B) Ccq1, (C) Poz1 and (D) Trt1TERT were monitored by dot-blot ChIP assays and corrected for changes in telomere length [36]. Error bars represent standard error of the mean from three to eight independent experiments. Statistical analysis of ChIP data by 2-tailed Student's t-test is shown in Table S5. Southern blot analysis of telomere length for strains used in ChIP assays is shown in Figure S12, and raw data for ChIP assays are shown in Figure S13. Expression levels of myc-tagged proteins were monitored by anti-myc western blot analysis of whole cell extracts. Anti-Cdc2 blots served as loading control. (E) Ccq1 Thr93 phosphorylation, detected by anti-phospho(S/T)Q (Phospho-(Ser/Thr) ATM/ATR substrate antibody, is enhanced in mutant cells lacking Tpz1-Poz1 interaction. For anti-FLAG blots, asterisk (*) indicates hyper-phosphorylated form of Ccq1.

