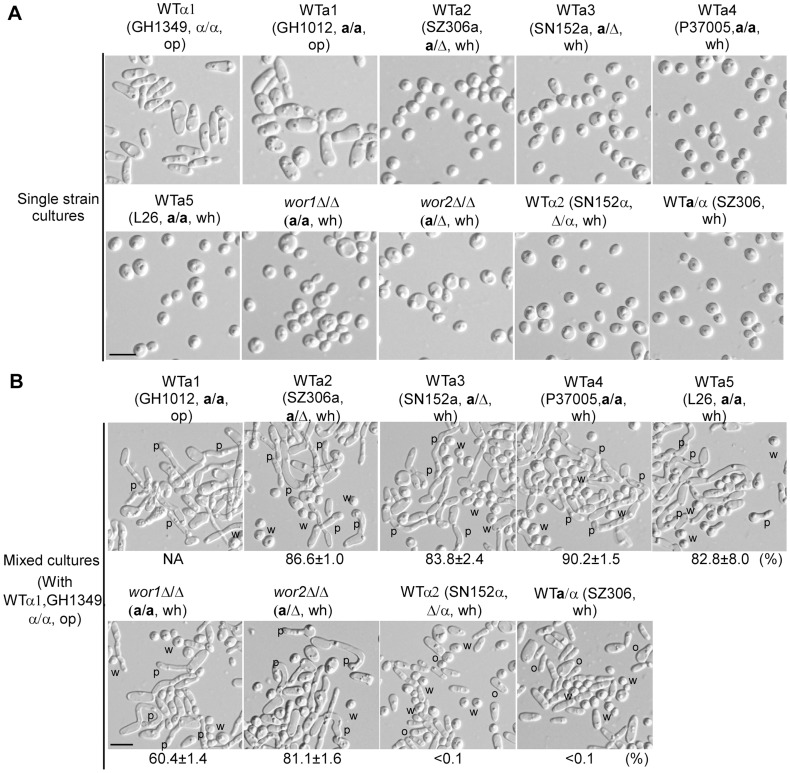
Figure 1. White a cells induce mating projection formation in opaque α cells in mixed cultures of white (a) and opaque (α) cells.
Strains: wor1Δ/Δ (GH1248, MTLa/a); wor2Δ/Δ (MMY627, MTLa/Δ). (A) Cellular images of single strain cultures. WTα1, GH1349, MTLα/α; WTα2, SN152α, MTLΔ/α. Five WT a strains of different background (WTa1 to WTa5) and the wor1Δ/Δ and wor2Δ/Δ mutants were used. SZ306, MTL a/α, served as a control. (B) Cellular images of mixed cultures. 4×10⁶ opaque α cells (GH1349) were mixed with 4×10⁶ cells of different background as indicated. The mixtures were spotted onto Lee's glucose medium and cultured at 25°C in air for 24 hours. Cellular images and percentages of opaque α cells (GH1349) with mating projections are shown. Cells with at least one mating projection were counted. The mixture of opaque α cells (GH1349) and opaque a cells (GH1012) served as a positive control. The percentage of opaque α cells (GH1349) with mating projections in the opaque a×α mixture is not shown since both α and a cells formed mating projections. SZ306 (a/α) and SN152α served as negative controls. NA, not available. W (or wh), white; O (or op), opaque; P, mating projection. Scale bar, 10 µm.

