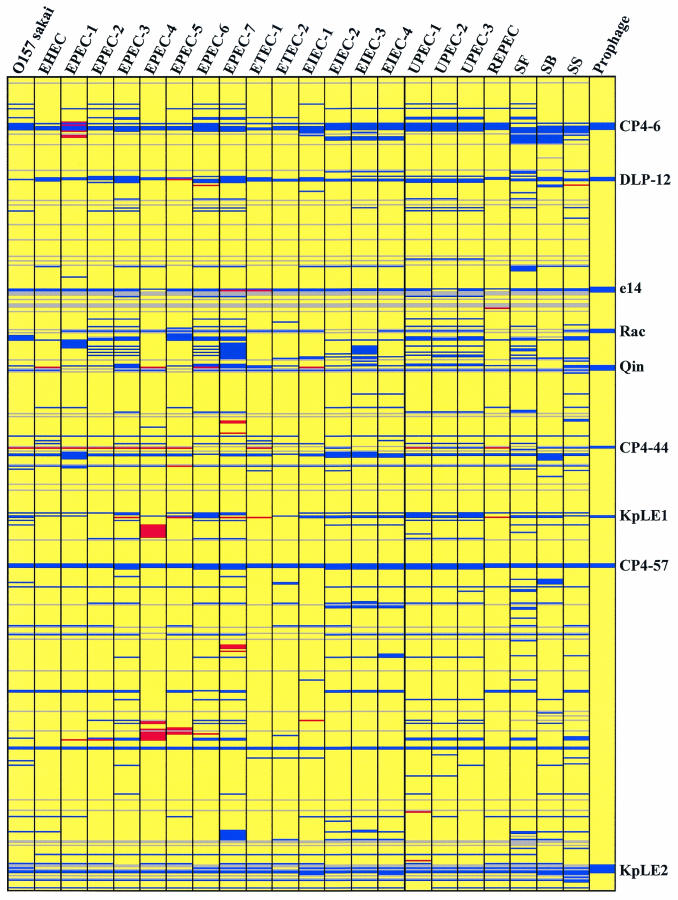
FIG. 1.
Genome composition based on CGH microarray data. Each row corresponds to a specific spot on the array, and the genes are arranged in order of JW number from JW0001 (b0002, thrA) at the top to JW4366 (b4403, lasT) at the bottom. The columns represent the strains analyzed; for an explanation of the abbreviations see Table 1. The colors indicate the status of the ORFs, as follows: blue, absent; yellow, present; red, putatively duplicated; grey, uncertain (not on the DNA array or invalid data). Nine prophage regions in the W3110 genome are indicated by blue bars in the Prophage column; the designations of these regions are indicated on the right.

