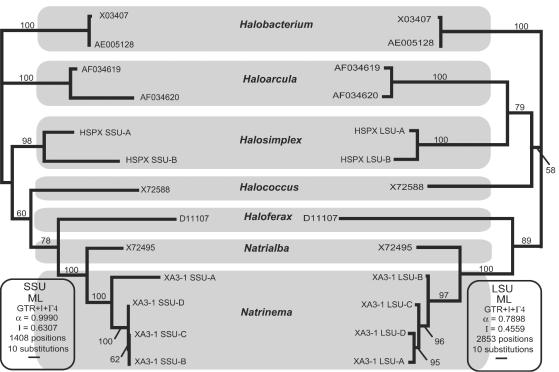
FIG. 6.
Comparison of best maximum-likelihood trees for the SSU and LSU genes of all genera of the Halobacteriales for which sequences of both genes were available. The evolutionary models and parameters used for the phylogenetic analyses are indicated (ML, maximum likelihood; GTR, general time reversible; I, proportion of invariable sites; α, gamma rate shape parameter alpha; Γ, number of gamma distribution rate categories). The numbers of nucleotide positions present in the edited alignment used in the phylogenetic analysis are also indicated. The bootstrap values at the nodes are the consensus values for maximum-likelihood trees for 1,000 pseudoreplicates.

