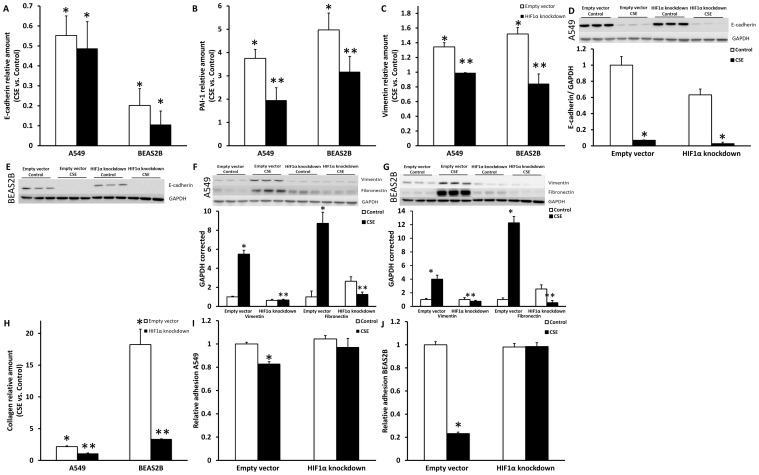
Figure 6. Induction of mesenchymal markers by CSE is HIF1α dependent.
Relative E-cadherin (A), PAI1 (B) and vimentin (C) mRNA levels after 48 hours of CSE stimulation (A549 2.5% CSE and BEAS2B 1.0% CSE) compared to control in A549 and BEAS2B cells stably transfected with PLKO.1 empty vector and shRNA HIF1α construct. Western blots and quantification of A549 en BEAS2B cells stably transfected with PLKO.1 empty vector and shRNA HIF1α construct after stimulation with for 48 hours for E-cadherin (D–E), vimentin and fibronectin (F–G) with GAPDH as loading control. Collagen in the medium, measured using sircoll assay (H). Adhesion in A549(I) and BEAS2B cells (J). Data are expressed as mean+SD, * indicates p<0.05 compared to control, ** indicates p<0.05 compared to empty vector.

