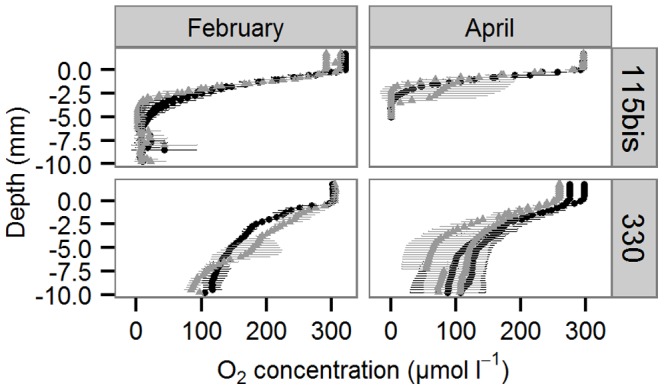
Figure 3. Sediment O2 profiles.

Mean ± sd O2 concentration in control (▴) and acidified (•) treatments of the two sediment types (115bis: fine sandy; 330: permeable) and two seasons (February and April).

Mean ± sd O2 concentration in control (▴) and acidified (•) treatments of the two sediment types (115bis: fine sandy; 330: permeable) and two seasons (February and April).