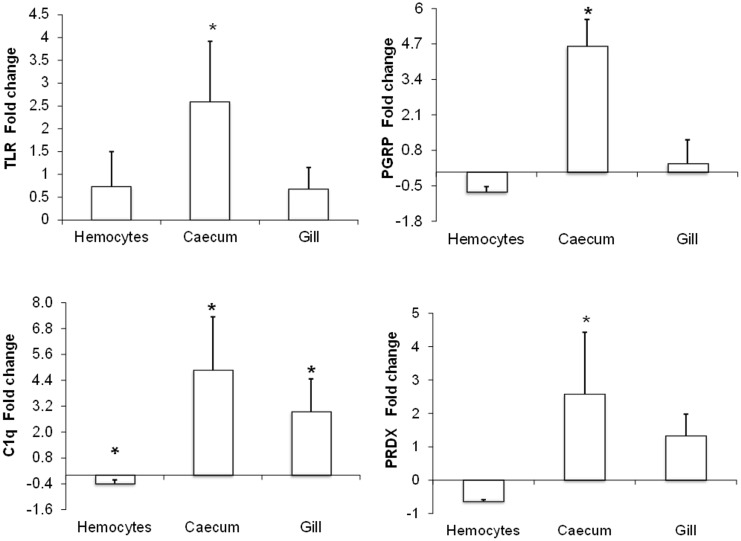
Figure 8. Fold change in gene expression analysis by RT-qPCR.
Tissue expression profiles of immune genes in O. vulgaris. Data represent the fold change in expression of the analyzed transcripts relative to β-acting transcript level of sick octopuses (highly infected by A. octopiana), referred to healthy octopuses (null or lowly infected by A. octopiana). Results are mean ± standard deviation. Asterisks denotes significant differences (P<0.05).

