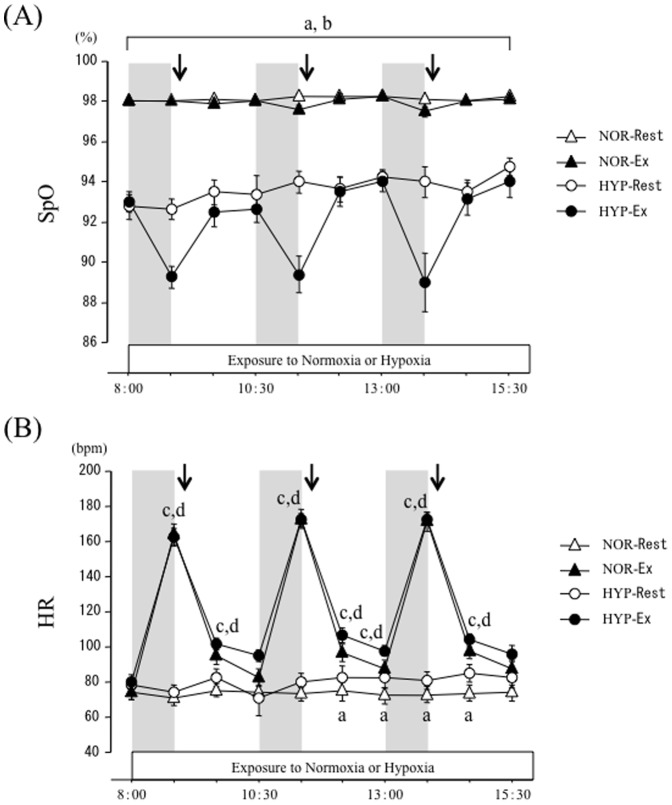
Figure 2. Time-course changes of SpO2 (A) and HR (B) over 7.5 h.
Each period of exercise is indicated by the shaded boxes. The arrow indicates the time of meal consumption. a; P<0.05, NOR-Rest vs. HYP-Rest. b; P<0.05, NOR-Ex vs. HYP-Ex. c; P<0.05, NOR-Rest vs. NOR-Ex. d; P<0.05, HYP-Rest vs. HYP-Ex.

