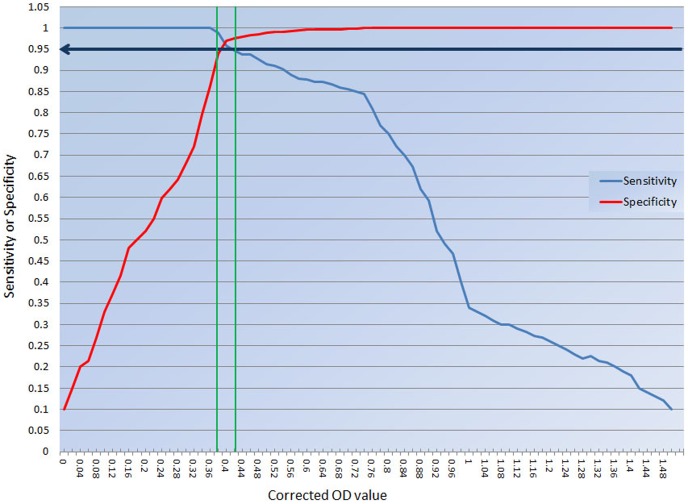
Figure 7. Evaluation of tM2e-MBP ELISA using sera from infected (challenged), non-vaccinated, and vaccinated chickens.
ANOVA and mean comparison using Tukey's test highlighted significant results in samples from infected birds compared to negative and vaccinated birds at p = 0.01. ANOVA and Tukey's tests showed statistically higher (p = 0.01) reactivity of infected (positive) compared to vaccinated and (negative) sera.

