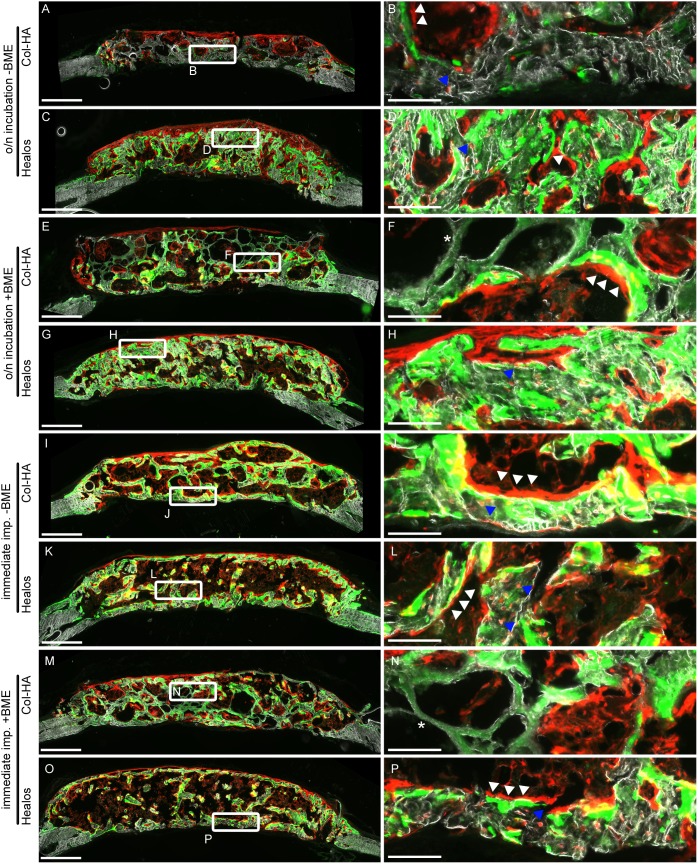
Figure 4. Histological sections of defects following 3 weeks of in vivo implantation.
(Left column) Defect wide view of scaffolds and mineralized tissue (darkfield channel), +TdTomato donor cells (red), and the mineralization label (green, calcein). Scale bars are 500 µm. (Right column) Magnifications of left column. Blue arrows indicate +TdTomato donor cells embedded in bone. White arrows indicate +TdTomato donor cells overlying mineral label. Scale bars are 100 µm.

