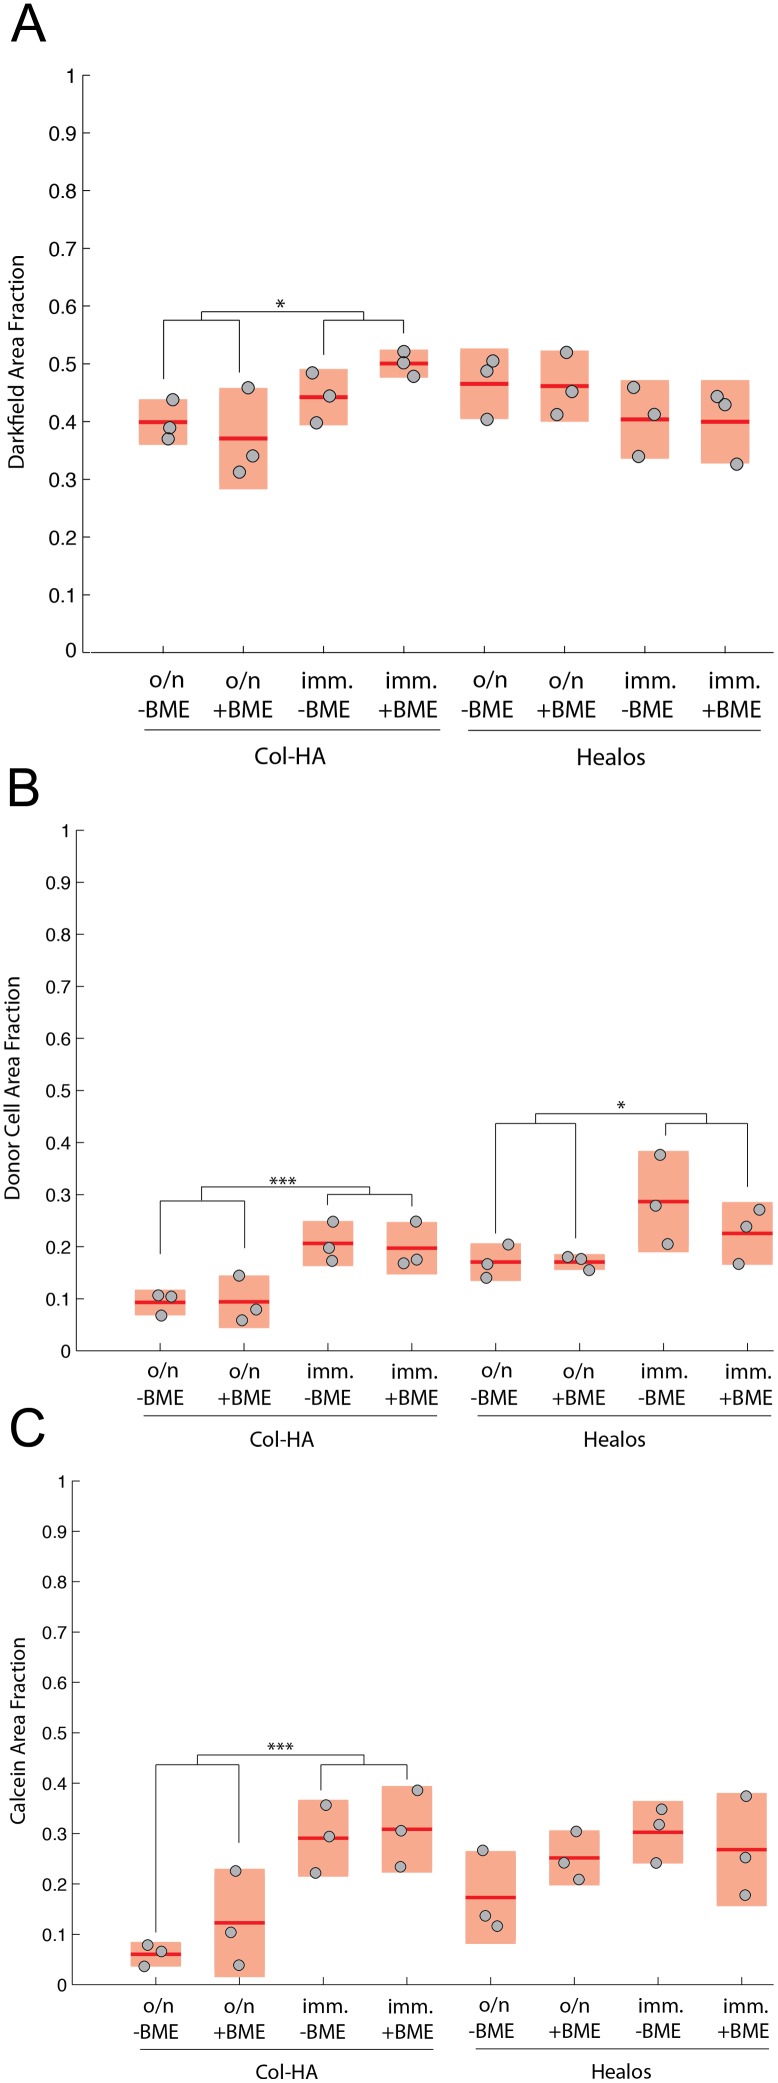
Figure 5. Quantitative histomorphometry of darkfield, donor cell, and calcein channels.
(A) Quantification of the darkfield area fraction in the defect area. (B) Quantification of donor cell area fraction using TdTomato signal. (C) Quantification of mineralizing surface using the calcein mineralization label. Light red bars indicate 95% confidence intervals and blue bars indicate one standard deviation.

