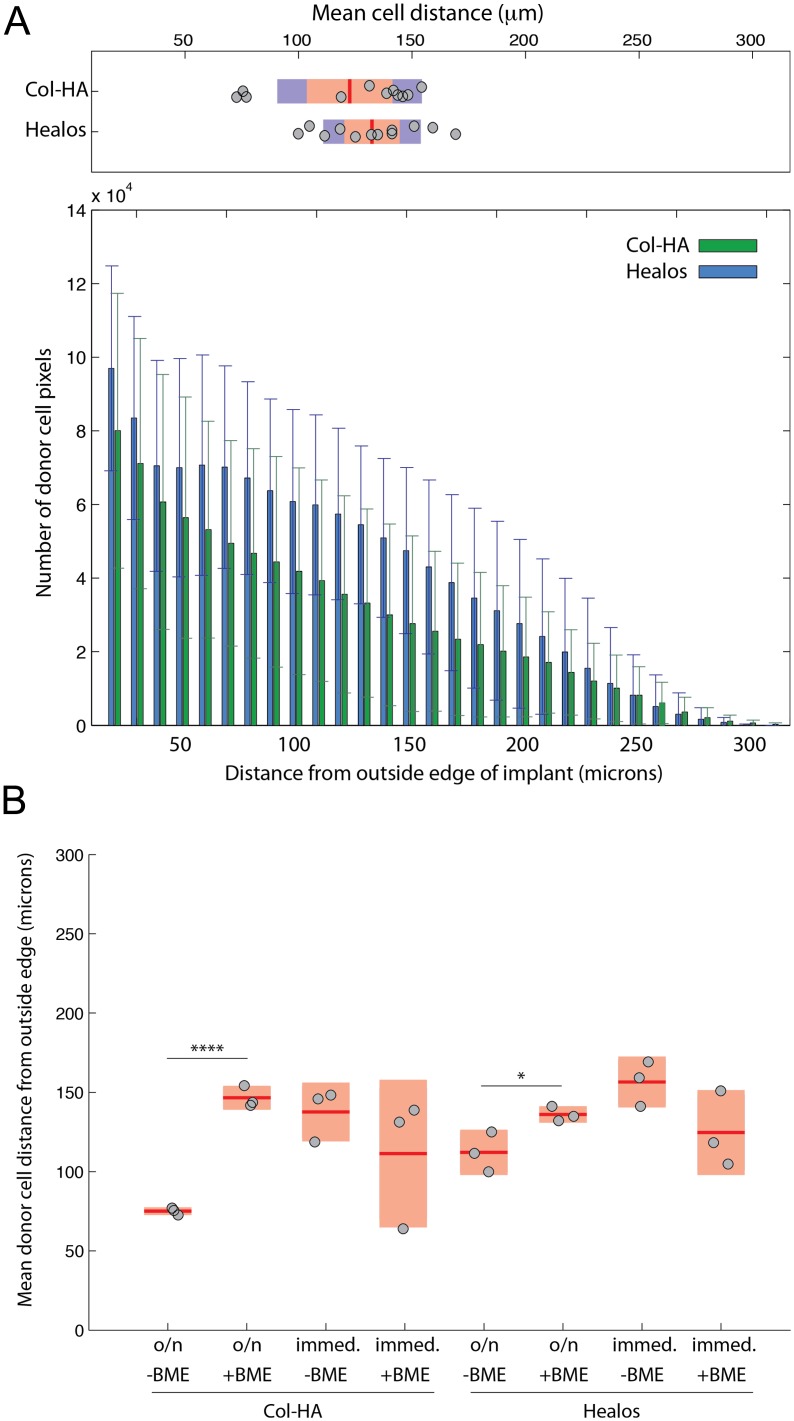
Figure 6. Donor cell distribution in the scaffolds.
(A) Comparison of donor cell distribution from the outside edge of the implant for Healos and Col-HA. Error bars indicate one standard deviation. Plot above shows a comparison of the means for each sample according to scaffold type. (B) Comparison of the mean donor cell distance from the outside edge of the implant. Light red bars indicate 95% confidence intervals and blue bars indicate one standard deviation.

