
Figure 9. Relationship between the internalized iron uptake (% control) and cellular iron released (% total) of series 1–6 using SK-N-MC neuroepithelioma cells.
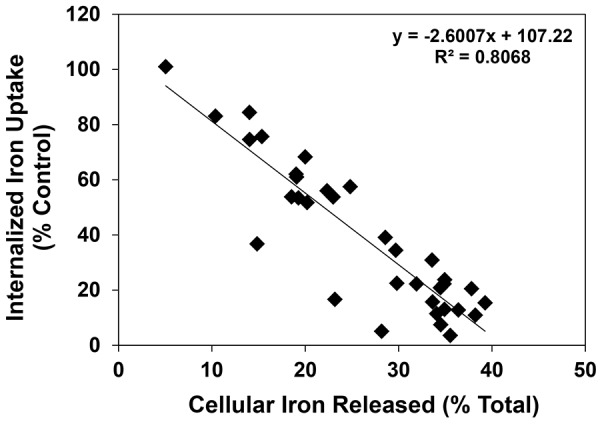
Lines were fitted in using Microsoft Excel 2010 (Microsoft, Redmond, WA).
Official websites use .gov
A
.gov website belongs to an official
government organization in the United States.
Secure .gov websites use HTTPS
A lock (
) or https:// means you've safely
connected to the .gov website. Share sensitive
information only on official, secure websites.
Lines were fitted in using Microsoft Excel 2010 (Microsoft, Redmond, WA).