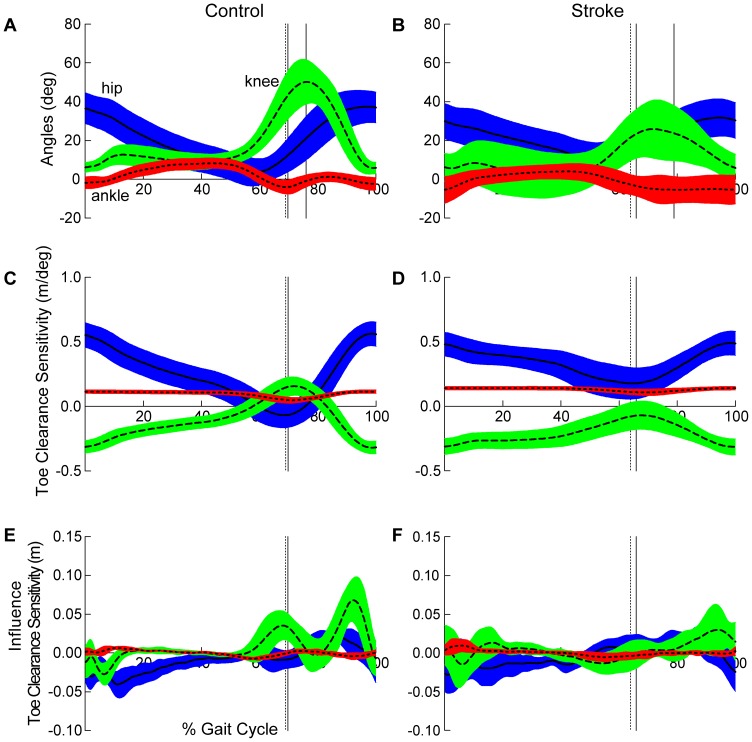
Figure 2. Sagittal plane joint angles and contributions to paretic toe clearance.
Healthy controls are depicted in the left and participants post-stroke in the right column. (a and b) Sagittal plane joint angles. Vertical cursor lines in represent toe off (dashed), minimal toe clearance (1st solid), and maximal limb shortening (2nd solid). (c and d) Toe clearance sensitivity - defined as the partial derivative of toe clearance with respect to sagittal plane hip, knee, and ankle angles. Positive values of TCsensitivity indicate a positive rotation at a given joint increases toe clearance. Note that the ankle contribution (dotted line) to toe clearance is approximately equal in control and stroke. However, the timing of sensitivity peaks differ between groups (Table 1). (e and f) Estimated influence of toe clearance sensitivity quantifies the contribution of each joint to toe clearance, regardless of direction of joint motion. Note the pattern of joint influence in healthy controls clearly indicating the knee serves as the primary contributor to toe clearance. Vertical cursors in (c–f) represent toe off (dashed) and minimal toe clearance (solid) for each group. Hip, knee, and ankle curves are depicted as solid, dashed, and dotted lines, respectively. Error clouds denote ±1 standard deviation. All curves are time normalized to the gait cycle.

