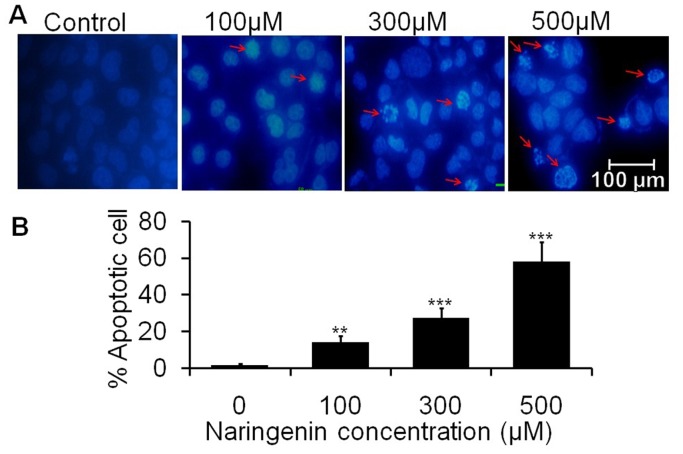
Figure 2. Chromatin condensation of A431 cells stained with DAPI after naringenin treatment.
Cells were treated with 100 µM, 300 µM and 500 µM of naringenin. (A) Photomicrographs were taken by florescence phase contrast microscope that showed fragmented and condensed nuclei as indicated by arrow (B) Numerical data were expressed as % apoptotic cells respective to their control. Data is representative of three independent experiments and expressed as means ± SD, **p<0.01 and ***p<0.001 as compared with their respective control.

