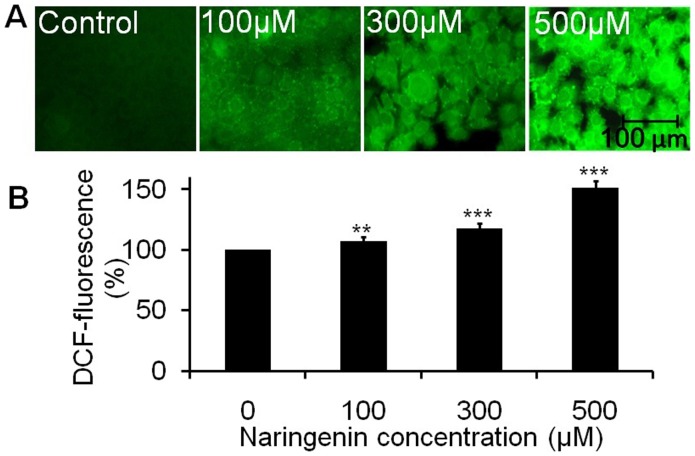
Figure 3. Photomicrographs showing intracellular ROS generation in A431 cells induced by naringenin and stained with DCFH-DA.
(A) Photomicrographs showing intracellular ROS generation induced by 100 µM, 300 µM and 500 µM of naringenin after 12 h incubation. Photomicrographs were taken by florescence phase contrast microscope (B) Values are expressed as the percentage of fluorescence intensity relative to the control. Values are expressed as means ± SD of at least three independent experiments, **p<0.01 and **p<0.001 as compared with their respective control.

