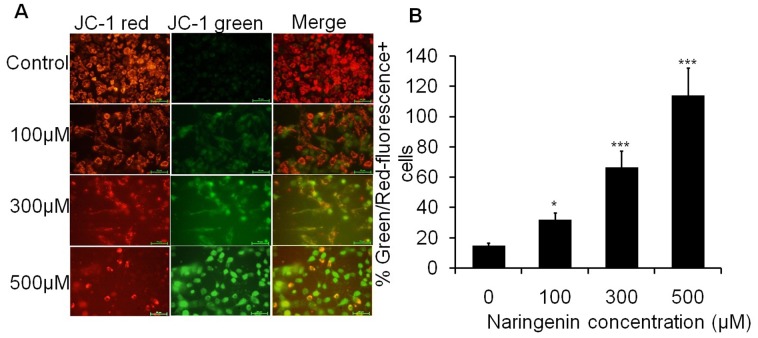
Figure 4. Fluorescence image of A431 cells stained with JC-1 after 24 h incubation with different concentrations of naringenin.
(A) Photograph showing JC-1 red, JC-1 green and merge image. The JC-1 green fluorescence indicates a decrease in mitochondrial membrane potential, an early event in apoptosis. Increased concentrations of naringenin attenuated the loss of mitochondrial membrane potential. (B) Numerical data were expressed as % Green/Red fluorescence+ cells which were increased with increasing doses of naringenin. Data is representative of three independent experiments and expressed as means ± SD, *p<0.05, **p<0.01 and ***p<0.001 as compared with their respective control.

