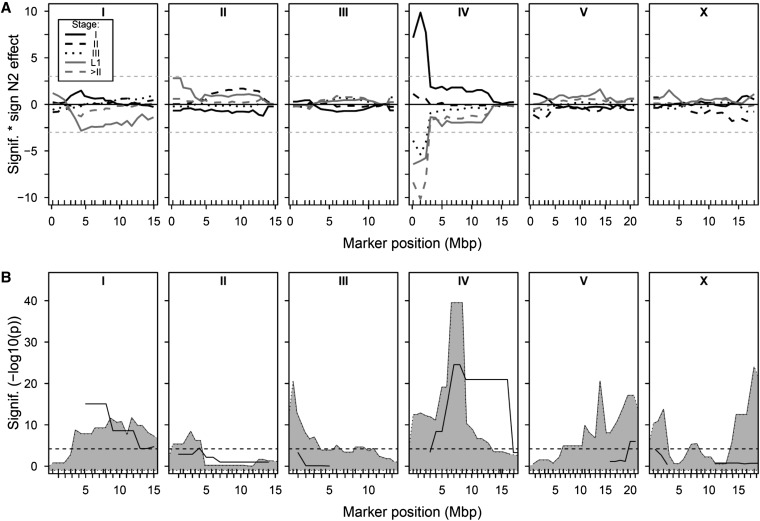
Figure 2.
QTL mapping in the RILs and ILs. (A) Mapping of embryo stage in the RILs, with the significance (−log10(p)) multiplied by the sign of the effect of the N2 allele plotted against the marker positions in mega base pairs for the percentage of total eggs in stage I eggs (black solid line), stage II eggs (black dashed line), stage III eggs (black dotted line), stage IV eggs (gray solid line), L1s (gray dashed line), and the proportion of progeny > stage II (gray dotted line). (B) Genome-wide bin mapping of late-stage embryo production (proportion > stage II), showing the significance (−log10(p)) by chi-square test of ILs sharing a certain genomic part against N2. RILs, recombinant inbred lines; ILs, introgression lines.

