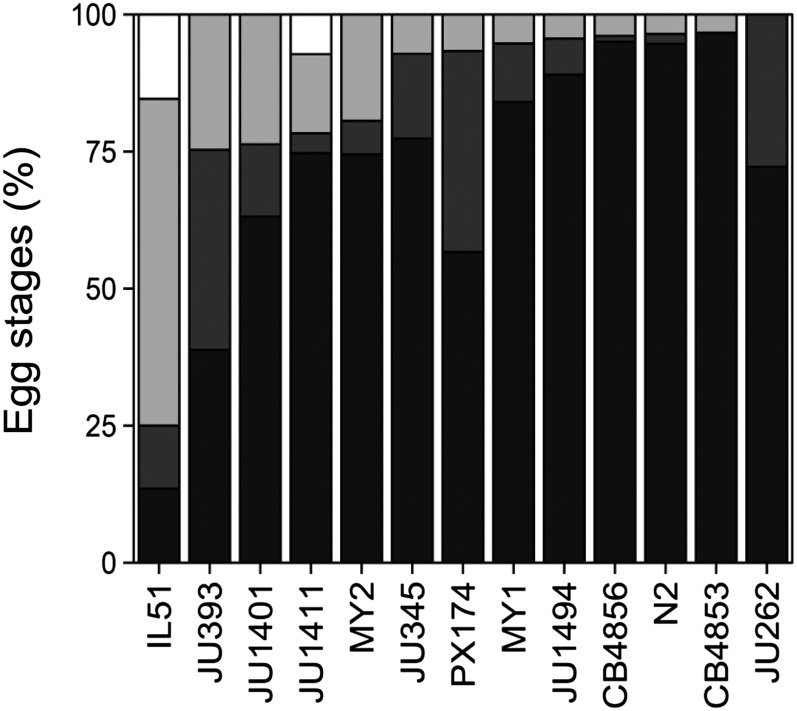
Figure 4.
Embryo stages of wild-isolates. Embryo stage distribution shown as cumulative percentage of total progeny. From dark to light: Stage I, II, III, and L1 (in white). CB4856 scores from different experiments (n = 281). (N = IL51 (ewIR51): 52; JU393: 85; JU1401: 76; JU1411: 83; MY2: 98; JU345: 84; PX174: 30; MY1: 94; JU1494: 91; CB4856: 103; N2: 112; CB4853: 60; JU262: 18). For > stage II eggs all the wild isolates are significantly different from ewIR51 (P < 0.01, two-sided t-test on plate averages). None of the > stage II differences between the wild-isolated were significantly different (P > 0.05, two-sided t-test on plate averages).

