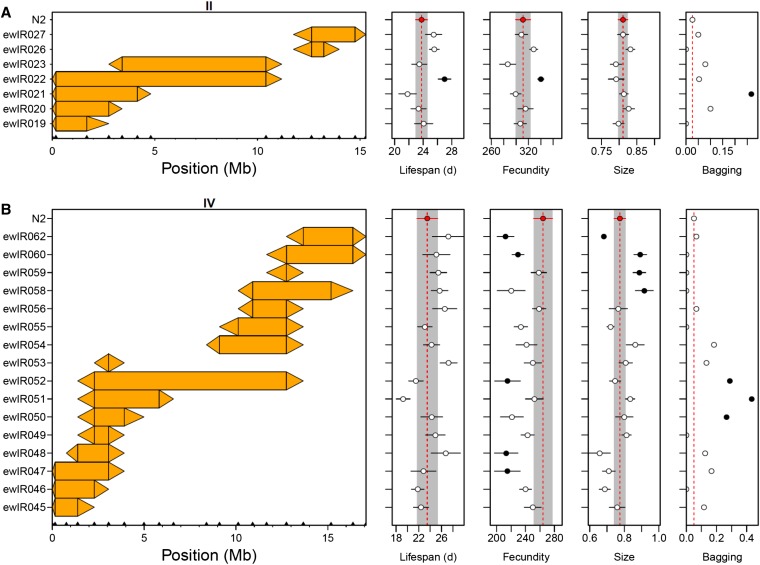
Figure 6.
Incompatibility QTL are associated with variation in other traits. Average lifespan, lifetime fecundity, body size at L4 and proportion of worms that die by bagging for ILs containing introgressions on chromosome II (A) and IV (B). The CB4856 introgression per IL is shown by the colored rectangle. Triangles join adjacent CB4856 and N2 markers. Error bars represent ± 1 SE, dashed lines and shaded bars represent trait values in N2 and ILs significantly different from N2 (P < 0.05) are shown in black. QTL, quantitative trait loci.

