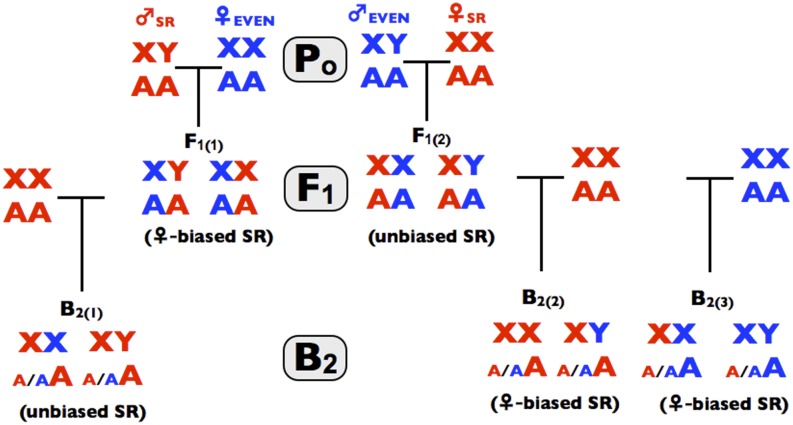
Figure 4.
The crosses use in the process-of-elimination assay. Red denotes genes, or individuals from the SR line and correspondingly blue for the control line. Po denotes the parental crosses in step 1 of the process-of elimination assay, F1 denotes progeny from the parental crosses (step 2 of the assay), and B1 denotes progeny form the backcrosses (step 3 of the assay). Parenthetical text denotes the observed pattern found in this study.

