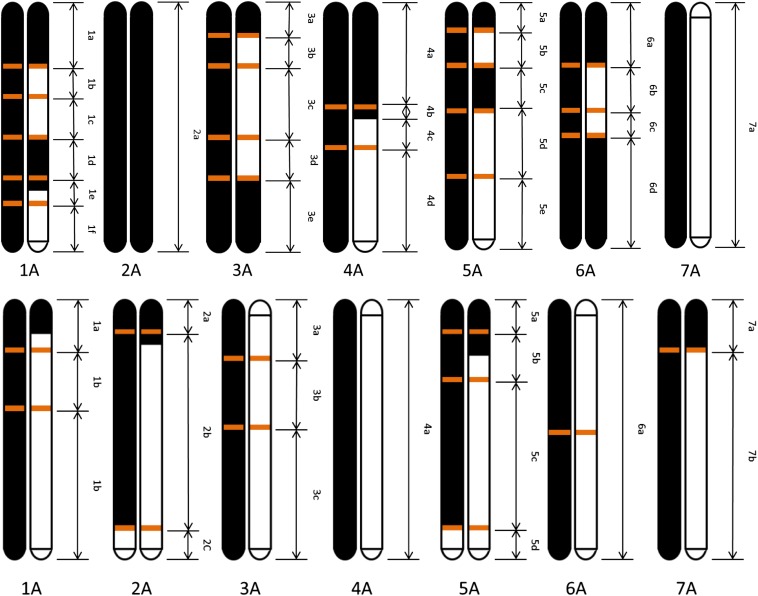
Figure 2.
Reconstruction of the parental chromosome contribution to the F2 plants from which the populations B53 (above) and B54 (below) were developed. Parents T. urartu ID1122 and T. monococcum ID396 are in white and black, respectively. Double arrows indicate the borders of chromosome segments to which groups of amplified fragment-length polymorphisms were anchored based on the linkage map of T. monococcum. The chromosome position of the recombination sites detected in this analysis is shown as orange bars.

