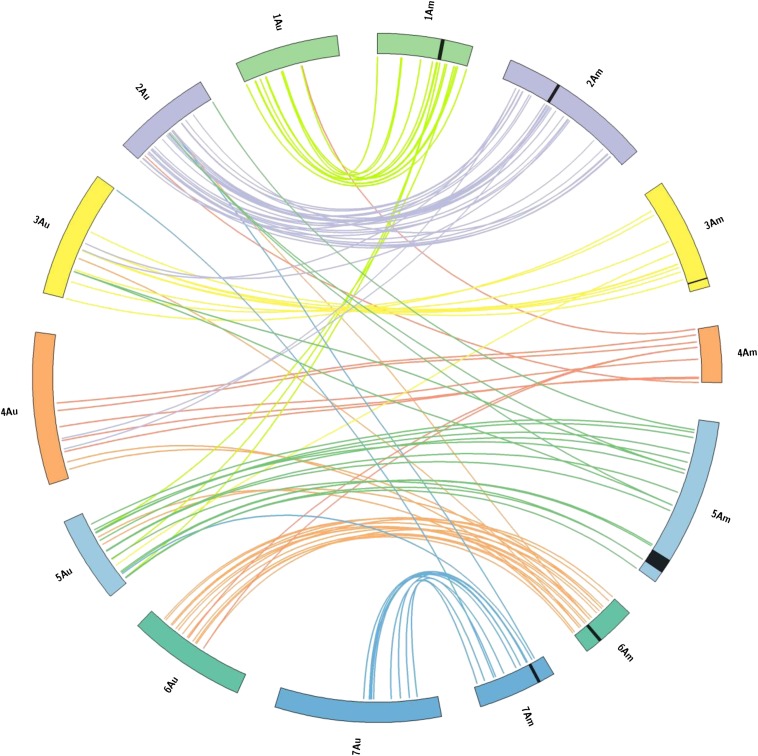
Figure 4.
Comparative macrocolinearity relationships between Au and Am genomes. Homeologous chromosomes are reported as specular circular segments with the same color. Chromosomes of the Am and Au genomes are specified (from 1 to 7 Am or Au). Lines connect map position of microsatellite loci in the Am genome (left) to T. urartu paralogous (right). Lines joining Am and Au chromosomes with different colors point to loci mapping in nonhomeologous linkage groups in T. monococcum and T. urartu. Lines joining Am and Au chromosomes with the same color evidence microsatellites loci mapping in T. monococcum and T. urartu in homeologous linkage groups.

