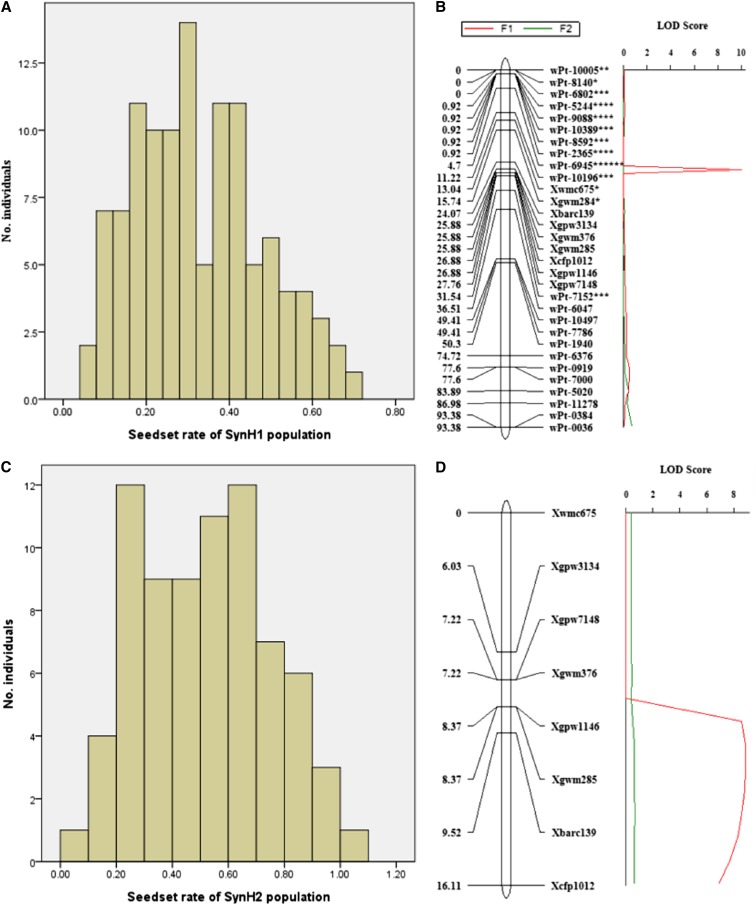
Figure 6.
Frequency distribution and QTL for hybrid genome doubling. Frequency distribution of haploid plants with different seed setting rate for populations SynH1 (A) and SynH2 (C) and a QTL for the two haploid (F1) populations (B and D, red). This QTL was not detected in the doubled haploid (F2) populations (B and D, green). Asterisk (*) after marker indicates deviation from the 1:1 expected segregation ratio at P < 0.05, ** at P < 0.01, *** at P < 0.005, **** at P < 0.001, and ****** at P < 0.0001.

