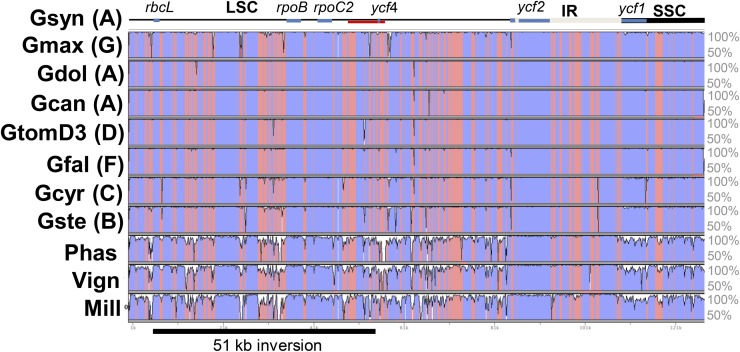
Figure 3.
Sequence similarity plot generated by VISTA tools. Base sequence is G. syndetika. Intergenic regions are pink. Shuffle LAGAN option used to align Phaseolus and Vigna that have 78-kb inversions. Hypervariable region identified by Magee et al. (2010) is demarcated by red line. Gene with low sequence similarity to other angiosperms, ycf4 is indicated, along with five other genes for orientation. Only one inverted repeat is shown.

