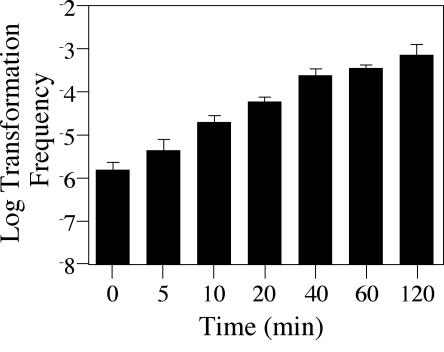
FIG. 5.
Kinetics of transformation in a broth assay. The figure shows transformation frequency as a function of time. Reporter strain JV1103 was grown in AYE at 30°C with low-speed shaking to early exponential phase. One-milliliter aliquots were removed, and 1 μg of reporter construct pJB957 (Kanr) DNA was added for 0, 5, 10, 20, 40, 60, or 120 min, followed by a 15-min incubation at 37°C with DNase I at 0.1 mg/ml. Bacteria were plated on selective media in order to determine the number of kanamycin-resistant transformants in the total cell population. The limit of detection for transformation frequency was 10−8; error bars indicate standard deviations.

