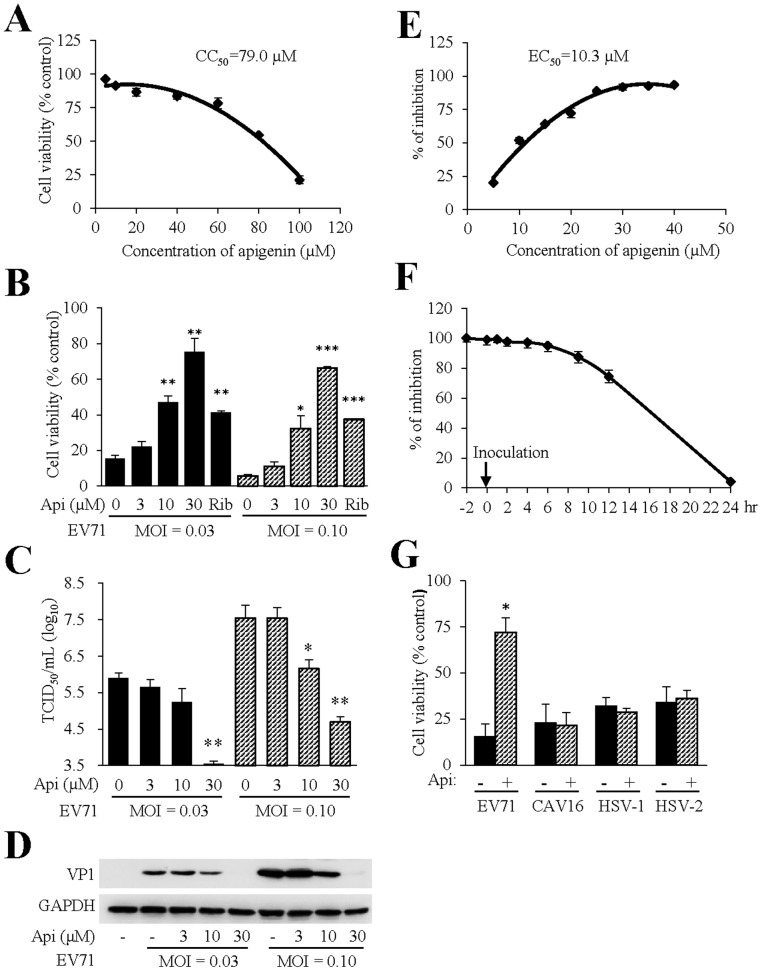
Figure 1. Inhibition of EV71 infection by apigenin. (A) Determination of CC50 of apigenin.
RD cells in 96 well plates were treated with apigenin at indicated concentrations. Cell viability was assayed at 72 hr post-treatment by measuring MTT reduction. OD readings of duplicate samples were plotted and used to extrapolate CC50 values using GraphPad Prism. The experiment was performed two times independently. Data are presented as mean ± standard deviation (SD) of duplicate samples. (B) Evaluation of apigenin antiviral activity by measuring cytopathic effect. The permissive RD cells were pretreated 2 hr prior to EV71 infection with apigenin at 3, 10, and 30 µM or mock-treated with DMSO. Ribavirin was included as a positive control. Two MOIs (0.03 and 0.10 TCID50 per cell, respectively) were used to infect the cells. The cytopathic effect due to EV71 infection was quantified by measuring cell viability with an MTT assay. The ratios of OD readings of infected samples over uninfected controls were used for this plot. The experiment was performed three times independently. The experiment was performed three times independently and data are presented as mean ± SD of duplicate samples. An unpaired t test was performed for statistical analysis. *: p≤0.05; **: p≤0.01; ***: p≤0.001. (C, D) Validation of apigenin antiviral effect against EV71 infection by titration and immunoblotting for viral VP1 expression. RD cells were pretreated with apigenin at 3, 10 or 30 µM or remained untreated. The cells were then infected with EV71 at MOI of 0.03 or 0.10 TCID50 per cell for 36 hr. Production of infectious virion production (C) or EV71 VP1 protein expression (D) were determined as described in experimental procedures. Titration data are presented as mean ± SD of triplicate samples. The experiment was performed two times independently. An unpaired t test was performed for statistical analysis. *: p≤0.05; **: p≤0.01. GAPDH expression was used as a loading control. (E) Determination of EC50 of apigenin anti-EV71 activity. RD cells in 96-well plates were treated with apigenin at varying concentrations or remained untreated. The cells were then infected with EV71 at an MOI of 0.01 TCID50 per cell for 72 hr. Cell viability was used as a measurement for antiviral effect. Ratios of OD readings of infected over uninfected controls were used for this plot. EC50 value was extrapolated using GraphPad Prism. The experiment was performed two times independently. Data are presented as mean ± SD of triplicate samples. (F) Time of drug-addition antiviral effect of apigenin. Monolayers of RD cells were pretreated (-2 hr) or treated with 30 µM apigenin at times as indicated. The cells were infected with EV71 at an MOI of 0.01 TCID50 per cell for 72 hr. Cell viability was measured using a MTT method. OD reading of triplicate samples at -2 hr of apigenin addition was used as a reference for 100% inhibition, and readings at other times were used to obtain relative inhibition rates at indicated times. The results are representative of two independent experiments. Data are presented as mean ± SD of duplicate samples. (G) Assay of apigenin antiviral effect against herpes simplex viruses (HSV) and coxsackievirus A16 (CAV16). Vero cells in triplicate were pretreated with apigenin at 30 µM and then infected with EV71, CAV16, HSV-1 or HSV-2 at an appropriate MOI for each virus for 48 hr. Cell viability was quantitatively measured by MTT assay. The percentages of viable cells were expressed using the ratio of OD readings of infected (solid bar) or infected and treated (hatched bar) samples vs uninfected and drug-treated controls. The experiments were performed twice independently. Data are presented as mean ± SD of duplicate samples. An unpaired t test was performed for statistical analysis. *: p≤0.05.

