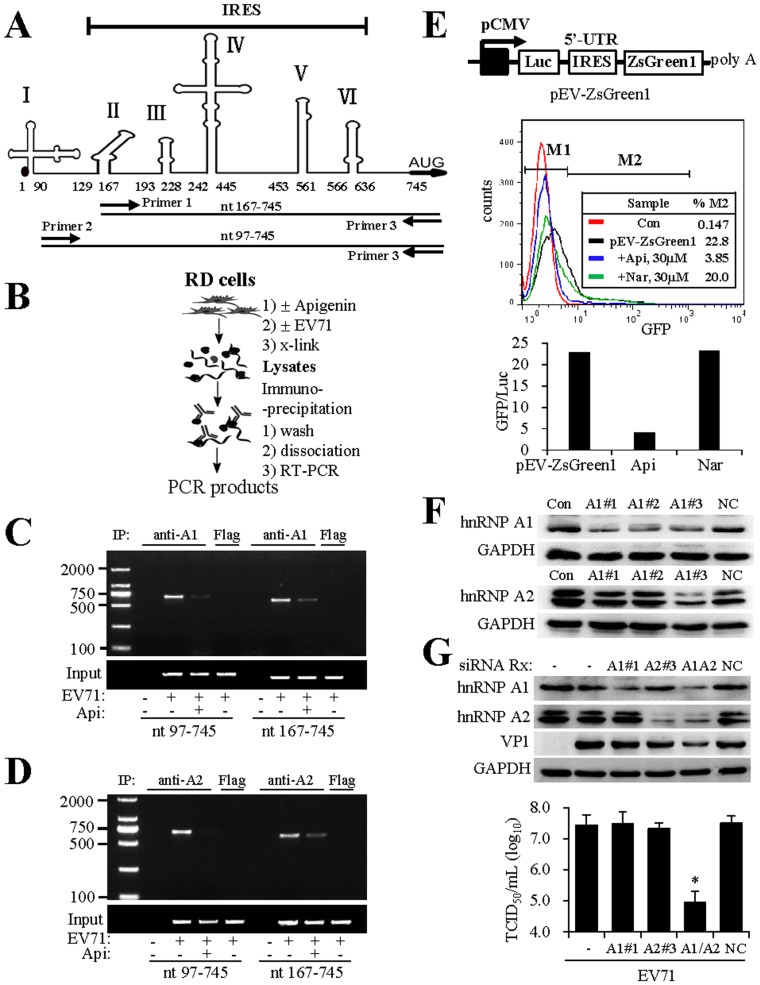
Figure 2. Apigenin disrupts EV71 RNA association with hnRNP A1 and A2 proteins. (A) Diagram of the 5′-UTR region of EV71 genome.
The 5′-UTR region of EV71 strain used in this study was sequenced and used for the prediction of secondary structure using MFOLD program and presented using ChemBioDraw. The numbers indicate relative position of nucleotides. Primers 1 to 3 indicate positions of corresponding oligos used for genome detection by RT-PCR. (B) Schematic drawing of experimental procedures of cross-link followed by immunoprecipitation and RT-PCR amplification for hnRNP-associated viral RNA. Detection of EV71 RNA association with hnRNP A1 (C) and hnRNP A2 (D) proteins. RD cells were pretreated with 30 µM apigenin or untreated. The cells were then infected with EV71 at an MOI = 40 for 6 hr. hnRNP-associated viral RNA was detected using RIP followed by RT-PCR. Anti-FLAG antibody was used as a control for immunoprecipitation. In those experiments, portions of the cell lysates were used to determine total RNA input by RT-PCR. Two sets of oligos (nt 97–745 and 167–745, respectively) were used for the detection of hnRNP-associated EV71 RNA. Data are representative of three independent experiments. (E) Suppression of apigenin on IRES activity. A bicistronic reporter gene system (diagram) was constructed for testing EV71 IRES activity. The plasmid, named pEV-ZsGreen1, was transfected to RD cells, using pRL as an internal control for firefly luciferase expression (refer to materials and methods). The expression of ZsGreen GFP was quantitatively measured by FACS analysis (middle panel). The expression of firefly luciferase and Renila luciferase was determined using Dual-Glo reagent. The percentages of GFP positive cells in apigenin-treated or control samples were plotted against luciferase activity (lower panel, arbitrary number using untreated pEV-ZsGreen1 as 1). The experiment was performed two times independently. (F) Screening of siRNAs that suppress hnRNP A1 or hnRNP A2 expression. RD cells in 24-well plates were transfected with a scrambled siRNA (NC, at 50 pmol/well) or an siRNA (50 pmol/well) targeting hnRNP A1 (named as A1#1 to 3) or hnRNP A2 (named as A2#1 to 3) expression. The sequences for those oligos are given in experimental procedures. The cells were harvested at 60 hr post transfection and protein expression was detected by immunoblotting. GAPDH expression was used as a control. A1#1 and A2#3 were selected and used for knockdown hnRNP A1 and hnRNP A2 studies. Results are representatives of three independent experiments. (G) Suppression of hnRNP A1 and A2 expression by siRNA inhibits EV71 infection. RD cells in a 24-well plate were transfected with a scrambled control siRNA (NC, 70 pmol/well), siRNA for suppression of hnRNP A1 (A1#1, 35 pmol A1#1 plus 35 pmol NC siRNA), hnRNP A2 (A2#3, 35 pmol A2#3 plus 35 pmol NC siRNA), or 35 pmol each of A1#1 and A2#3 (A1+A2) for combined suppression of hnRNP A1 and A2 expression. The cells were fed with fresh medium at 60 hr post transfection and then infected with EV71 (MOI = 0.10) for another 36 hr. Protein expression was detected by immunoblotting. In parallel experiments, the samples were harvested and infectious virion production was determined by titration. Results are representatives of two independent experiments. Data are presented as mean ± SD of triplicate samples. An unpaired t test was performed for statistical analysis. *: p≤0.05.

