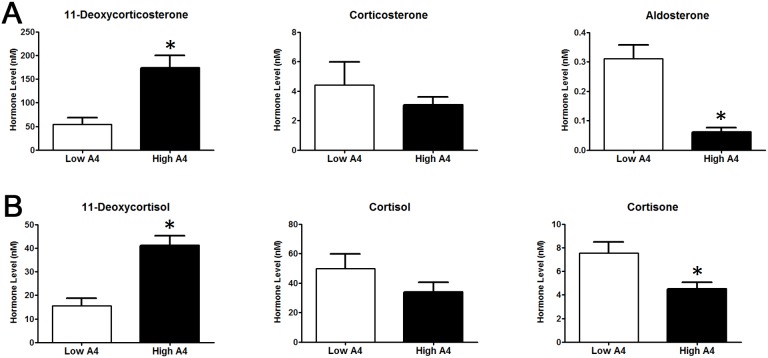
Figure 3. HPLC/MS-MS Analysis of Dominant Follicle Mineralocorticoid and Glucocorticoid Concentrations Collected after Ovariectomy.
Difference in mineralocorticoid (A) and glucocorticoid (B) concentration in dominant follicle determined by HPLC/MS-MS (Biocrates Life Sciences AG) analysis for High A4 (black bars) and Low (white bars) A4 cows.*P≤0.05.

