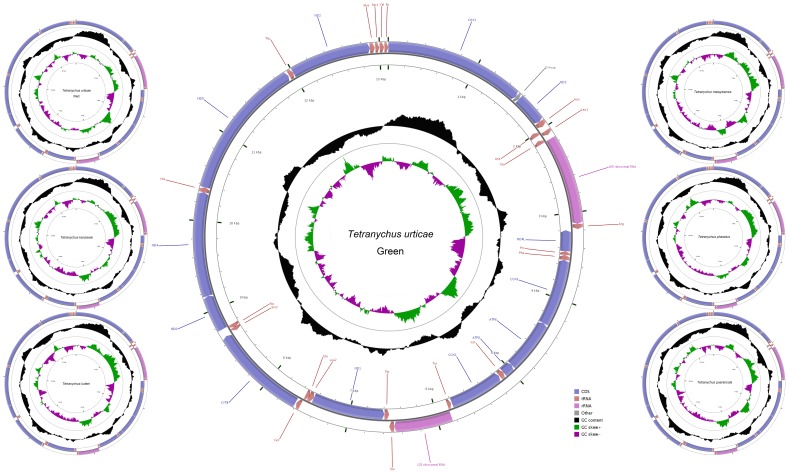
Figure 1. Mitochondrial genome maps of T. urticae (green and red forms), T. kanzawai, T. ludeni, T. malaysiensis, T. phaselus and T. pueraricola.
From outer to inner, the 1st circle shows the gene map and tRNA genes are abbreviated by triple letter, with Leu1 = CUN, Leu2 = UUR, Ser1 = AGN and Ser2 = UCN. The 2nd circle shows the GC content and the 3rd shows GC skew calculated as (G−C)/(G+C). GC content and GC skew are plotted as the deviation from the average value of the entire sequence.

