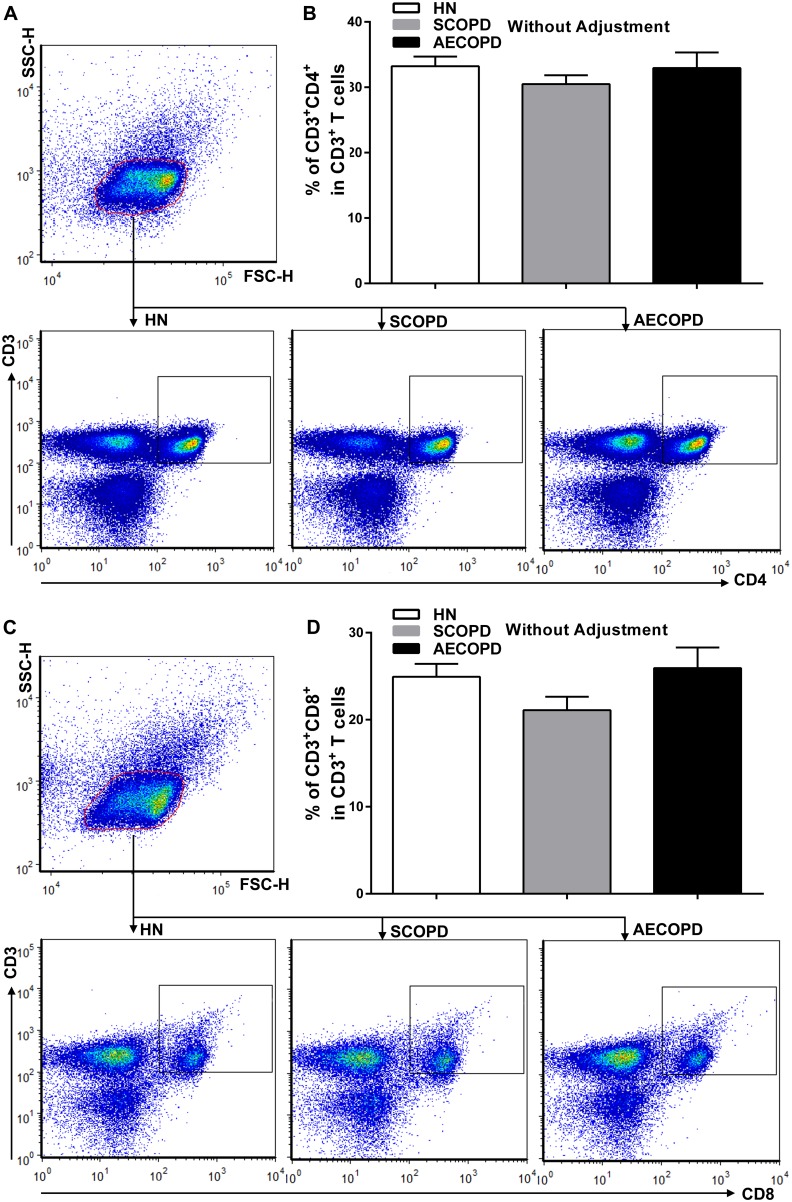
Figure 2. Flow cytometric analysis of CD4+ and CD8+ T cells in peripheral blood.
Lymphocytes were gated on forward scatter height (FSC-H) versus side scatter height (SSC-H) plots, and representative dot plots gated on lymphocytes show CD3+CD4+ T cells (A) and CD3+CD8+ T cells (C) in the peripheral blood obtained from a single subject from each group. The collective analyses show the expression of CD4 (B) and CD8 (D) on CD3+ T cells from healthy nonsmokers (n = 20) and subjects with SCOPD (n = 23) and AECOPD (n = 21). The data are presented as the mean ± SEM, unless otherwise stated.

