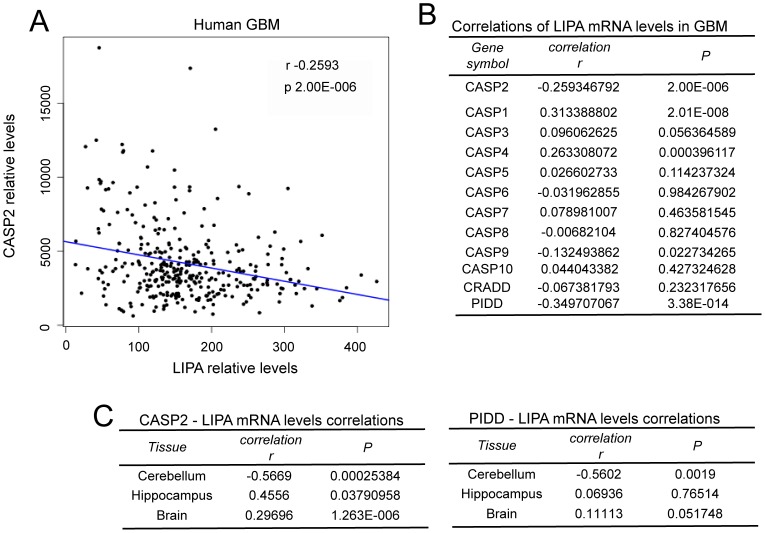
Figure 3. Analysis of LIPA and caspases expression in GBM and different areas of the CNS.
A. Plot of CASP2 versus LIPA expression levels in GBM. Linear regression is reported. B. Correlations in expression levels between LIPA and the indicated genes in GBM. C. Correlations in expression levels between LIPA and the indicated genes in different CNS areas.

