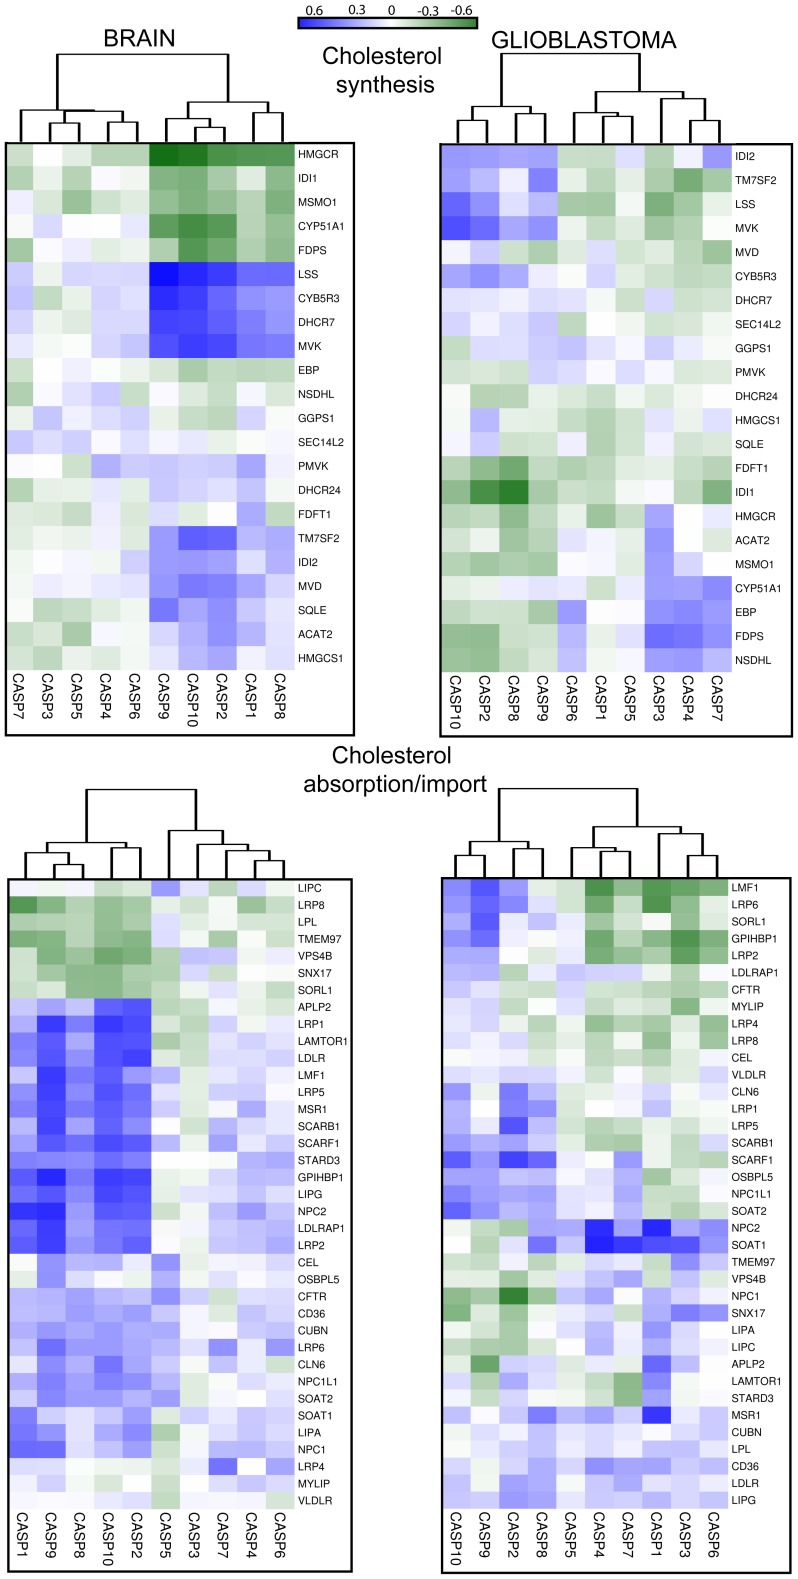
Figure 5. Co-expression analysis of caspases and cholesterol genes in human brain and GBM.
Correlations in terms of expression levels between caspases and cholesterol genes in different brain and GBM samples, for the indicated categories. Data obtained were used to calculate the correlation values with the Pearson method. In the heat map positive values are displayed in blue and negative in dark green. The dendrograms displayed on the top are based on hierarchical clustering using the complete linkage method.

