
Figure 3.
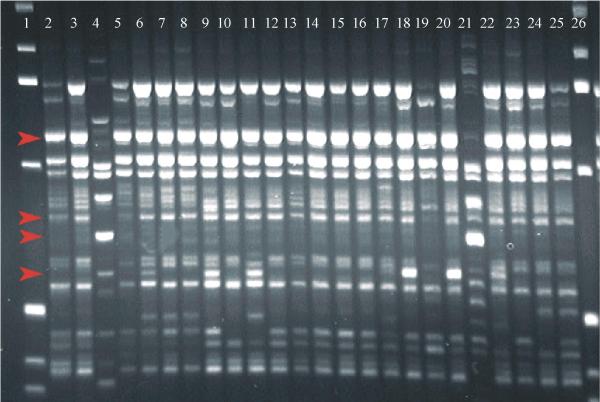
RAPD amplification products submitted to agarose gel electrophoresis and visualized by ethidium bromide staining under UV light. From left to right: Lanes 1 and 26: ladder 1 Kb; Lanes 2 to 27: melon accessions in the order of appearance on Table 1. Arrows indicate polymorphic markers used for analysis.