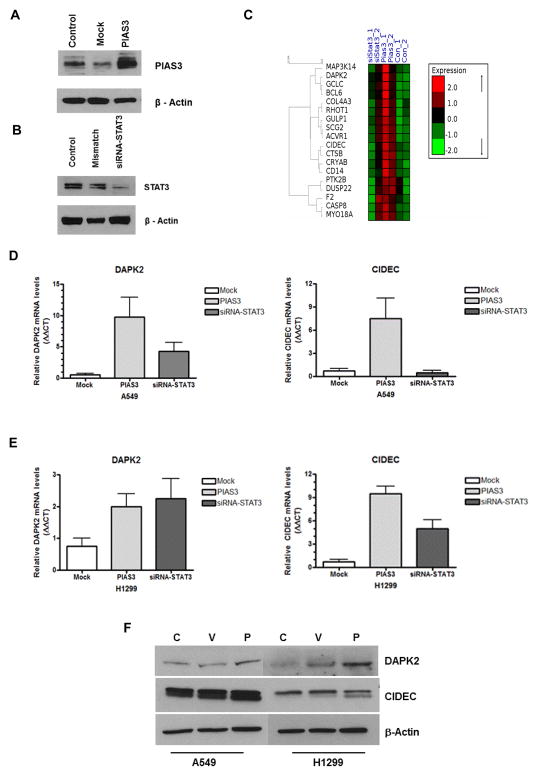
Figure 5. PIAS3 induces STAT3-independent apoptotic gene expression.
Confirmation of PIAS3 overexpression (A) and STAT3 knockdown with siRNA (B) in A549 cells after 48 h treatment by western blotting. No treatment (Control) and either mock empty vector transfection (A) or mismatched siRNA (B) were used as experimental controls. (C) Heat map of microarray data of apoptotic genes from A549 cells treated as described above. The mRNA signals of hybridization experiments were clustered based on significance. Green indicates negative values and red indicates positive values. Samples were clustered using a hierarchical clustering program to show sample-to-sample relationships (brackets). The full list of genes is in the supplementary figure. (D) and (E) Validation of DAPK2 and CIDEC mRNA expression by real-time qPCR analysis after 48 h of indicated treatment in A549 (D) and H1299 (E) cells. Samples were normalized against β-actin and results expressed as ΔΔCT. (F) Western blotting of CIDEC and DAPK2 protein expression 24 h after PIAS3 transfection.

