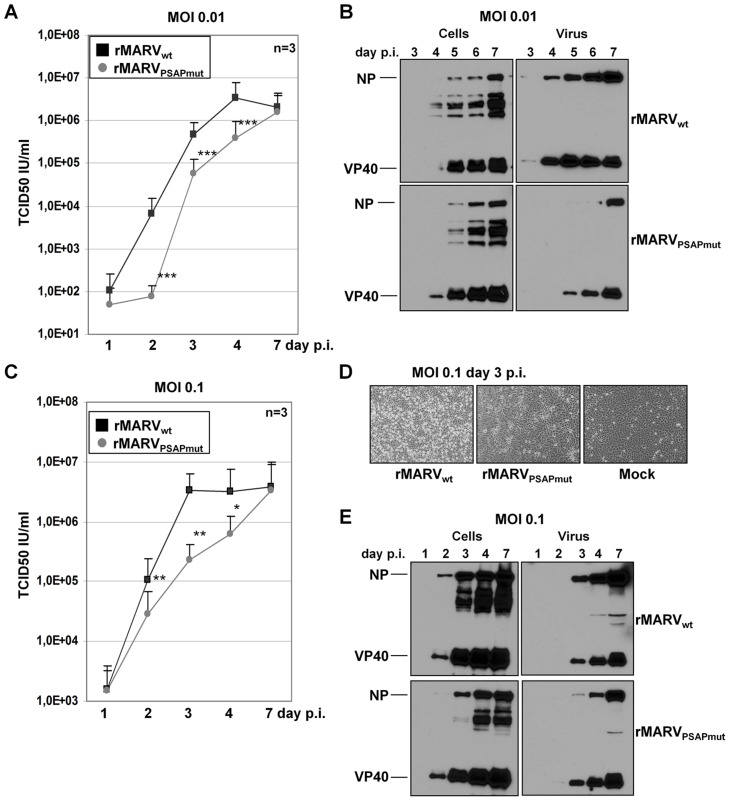
Figure 2. rMARVPSAPmut exhibits delayed growth kinetics.
Vero E6 cells were inoculated with either rMARVPSAPmut or rMARVwt. Supernatants and cell lysates were collected at indicated time points p.i. and viral titres determined by TCID50 assay or subjected to Western blot analysis. (A) Growth kinetics of rMARVPSAPmut (grey circle) or rMARVwt (black square) at MOI of 0.01. (B) Western Blot analysis of viral protein levels during an infection at MOI of 0.01. Cell lysates and culture supernatants were collected at indicated time points and were analyzed by SDS-PAGE and Western Blotting using NP- and VP40-specific antibodies. (C) Growth kinetics of rMARVPSAPmut (grey circle) or rMARVwt (black square) at MOI of 0.1. (D) rMARVPSAPmut- or rMARVwt– or mock-infected cells were analyzed for CPE formation during infection at MOI of 0.1 at 3 days p.i. (E) Western Blot analysis of viral protein levels during an infection at MOI of 0.1. Cell lysates and culture supernatants were collected at indicated time points and were analyzed as described in Fig. 1B. P-values are indicated (*, P≤0.05; **, P≤0.001; ***, P≤0.0001).

