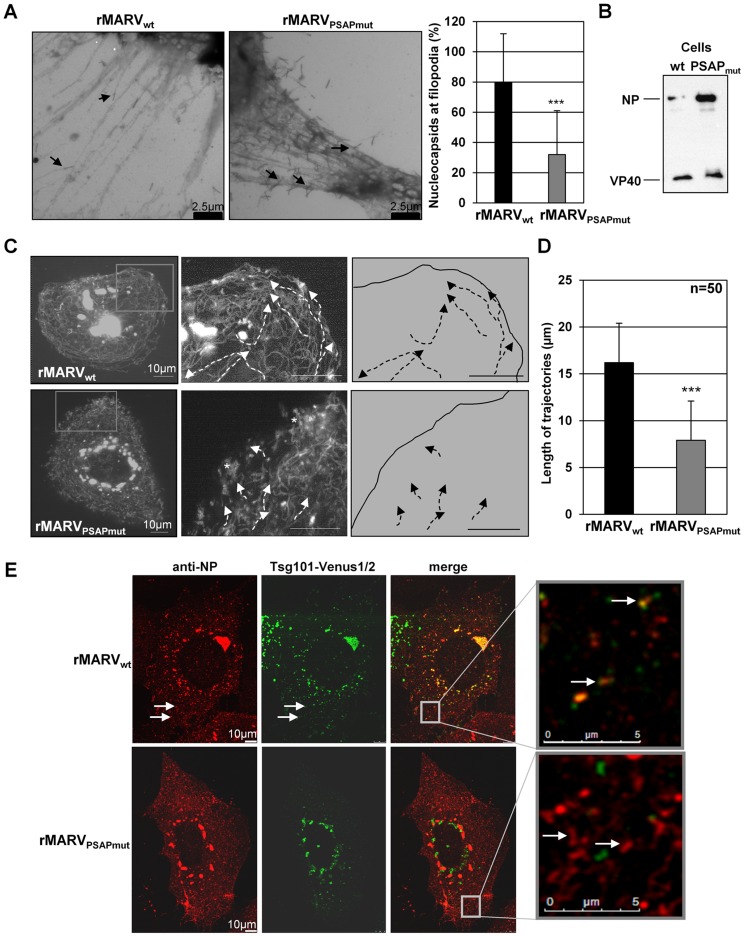
Figure 8. Budding from filopodia is reduced in rMARVPSAPmut-infected cells.
(A) Huh-7 cells were infected with rMARVwt or rMARVPSAPmut at an MOI of 1, and fixed at 19–23 h p.i. The whole mounted cells were analyzed by electron microscopy on grids after negative staining. Graphics shows the percentage of nucleocapsids in the process of budding from the filopodia (20 micrographs were analyzed for each virus), p-value (*** P≤0.0001). (B) Western Blot analysis of viral proteins in cell lysates. Huh-7 cells were infected as indicated in (A), harvested at 19 h p.i., and analyzed by using NP- and VP40-specific antibodies. (C) Live cell imaging of Huh-7 cells were infected with rMARVwt- or rMARVPSAPmut. At 28 h (rMARVPSAPmut) and 43 h p.i. (rMARVwt), a series of 600 pictures was taken every second for a period of 10 min. Maximal projection of the picture series is displayed. Boxes in the left panels indicate areas that are shown at higher magnification in the middle panels. Trajectories of individual nucleocapsids are highlighted with white dashed lines. White asterisks indicate regions with several static rMARVPSAPmut nucleocapsids. Right panels show the trajectories of nucleocapsids in rMARVwt- or rMARVPSAPmut-infected cells. Bars, 10 µm. (D) Length of nucleocapsid trajectories. The length of nucleocapsid trajectories was measured in rMARVwt- or rMARVPSAPmut-infected cells using the Leica LAS AF software, p-value (***, p≤0.0001). (E) Co-localization of Tsg101-Venus1/2 with MARV inclusions and nucleocapsids. Huh-7 cells were infected either with rMARVwt or rMARVPSAPmut and transfected with Venus1-Tsg101 and Venus2-Tsg101 plasmids. Cells were fixed at 22 h p.i. and subjected to immunofluorescence analysis with a NP-specific antibody. The Tsg101-Venus1/2 signal is displayed in green and the NP signal in red. Merged pictures show the overlay. The grey boxes indicate marginal region of cells, which are shown at higher magnification in the right panels. Arrows indicate nucleocapsids (approximately 1 µm in length).

