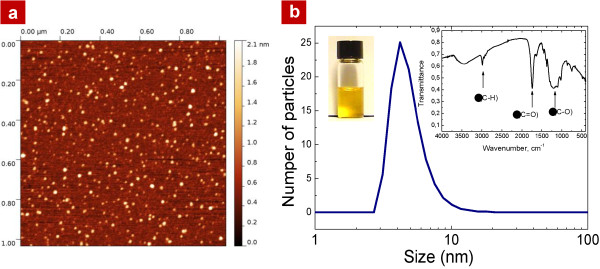
Figure 1.

AFM visualization and dynamic light scattering measurements of the obtained NPs. (a) AFM image of the used CFO NPs; (b) size distribution of the CFO NPs, the left inset shows colloidal aqueous solution with the dispersed CFO NPs and the right inset gives an idea on their dominating chemical bonds.
