Figure 4.

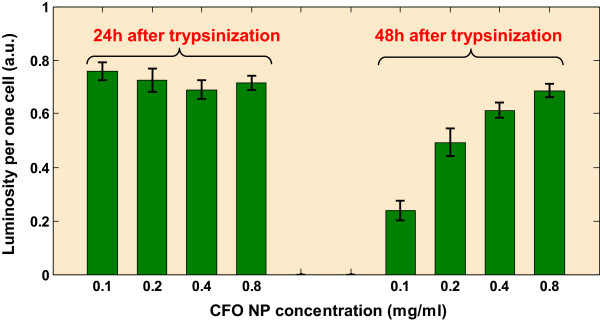
Quantitative summary of observed effects illustrated by previous images. Luminosity per one fibroblast cell as function of the NP concentrations for t1 = t0 + 24 h and t2 = t0 + 48 h.

Quantitative summary of observed effects illustrated by previous images. Luminosity per one fibroblast cell as function of the NP concentrations for t1 = t0 + 24 h and t2 = t0 + 48 h.