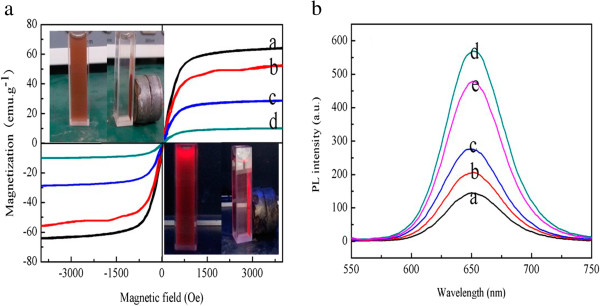
Figure 8.

Magnetization curves measured for the nanoparticles obtained. (a) (a) naked Fe3O4 NPs, (b) CS-coated Fe3O4 NPs, (c) CdTe-CS-coated Fe3O4 NPs and (d) Fe3O4-CdTe@SiO2 NPs; The fluorescent spectra of the CdTe-CS-coated Fe3O4 NPs with different content of CdTe QDs. (b) (a) 10 ml CdTe QDs, (b) 20 ml CdTe QDs, (c) 30 ml CdTe QDs, (d) 50 ml CdTe QDs and (e) 60 ml CdTe QDs.
