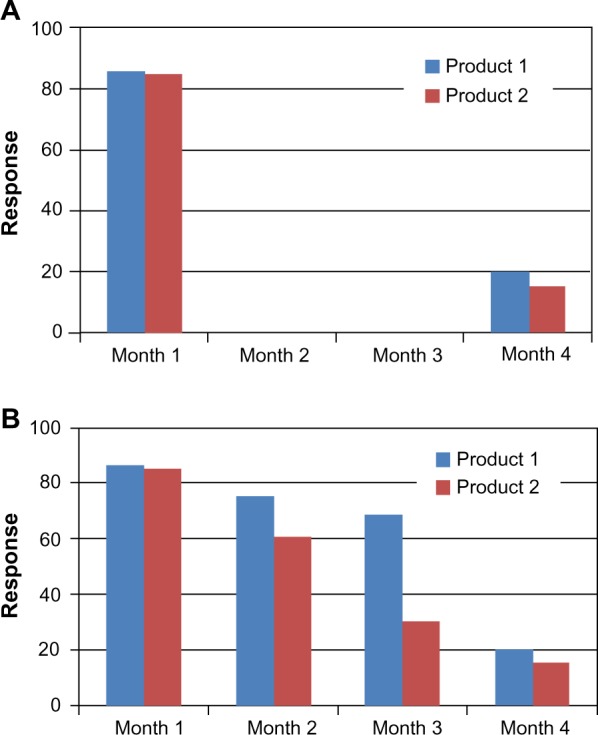
Figure 1.

Comparison of clinical response of two hypothetical BoNTA products.
Notes: (A) Graph showing hypothetical response at months 1 and 4 for two different products. Assessed at only month 1 and 4, the products may appear equivalent. (B) Graph showing hypothetical response at months 1, 2, 3, and 4 for the same two products. The products clearly exhibit different pharmacodynamics, as evidenced at months 2 and 3.
