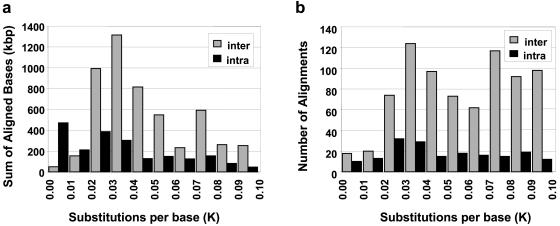
Figure 2.
Pairwise sequence distance (K) of chromosome 22 duplications. The two histograms show the distribution of genetic distance in terms of the number of aligned base pairs (a) and the number of alignments (b). Alignments are separated into interchromosomal (gray) and intrachromosomal (black). Distance (K) is the number of substitutions per 100 bp aligned and was corrected for multiple substitutions (see Material and Methods section).

