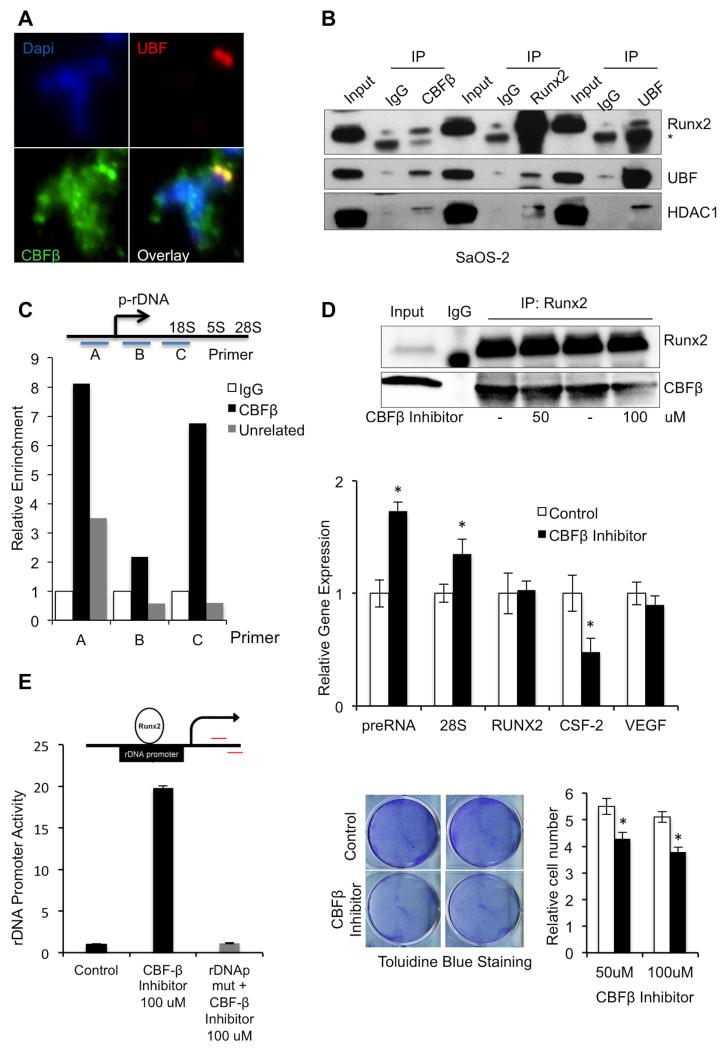
FIGURE 2. CBFβ Association with Pol-I ribosomal machinery.
A, Immunofluorescence staining in mitotic spreads with UBF CBFβ primary antibodies indicates that, like UBF, CBFβ is present in NORs during mitosis; B, Whole cell lysates from asynchronous SaOS-2 cells were immunoprecipitated using CBFβ, RUNX2 or UBF antibodies; normal IgG was used as a nonspecific control. The IP products were evaluated by Western blot with RUNX2, UBF and HDAC1. Signal from IgG heavy chain [IgG] was detected in some samples, depending on the primary and secondary antibodies used. The results suggest that these proteins associate in cells; C, To confirm that CBFβ associates with the ribosomal gene transcription complex, ChIP was performed in SaOS-2 cells using a CBFβ, unrelated, or normal IgG antibody. The immunoprecipitated DNA fragments were amplified using real-time PCR with one of 3 primer sets that span the ribosomal gene promoter (top, (27)). Relative enrichment of all three ribosomal gene promoter regions was seen in samples that used CBFβ antibody for ChIP compared to that seen in control ChIP samples (bottom). D, To evaluate the effect of the CBFβ/RUNX2 complex on ribosomal gene expression, SaOS-2 cells were treated with CBFβ inhibitor (or DMSO-only as a control) for 3 days. Samples were then subjected to IP using RUNX2 antibodies and immunoprecipitated protein was evaluated by Western blot (upper panel). RT-qPCR analysis of ribosomal gene expression was conducted using methods and primers described previously (23,27). This analysis suggests that CBFβ inhibition results in increased levels of preRNA and 28S ribosomal gene transcripts and decreased CSF-2 expression levels; RUNX2 and VEGF levels were equivalent with and without CBFβ inhibitor treatment (middle panel). Data are presented as mean ± standard deviation (SD) (n=3). (*) indicates P <0.05 when compared to DMSO-treated control cells; t- test analysis was performed. The effects of CBFβ inhibitor (black bars), compared to DMSO-only treatment (white bars) on cell proliferation were evaluated using Toluidine Blue staining and relative cell count (n=3, mean ± SD (*) indicates P < 0.05; t-test). Both analyses suggest that CBFβ inhibition reduces cell proliferation (lower panels). E, Analysis of CBFβ inhibition on rDNA promoter activity via RUNX2. An rDNAp (top) was transfected into SaOS-2 cells and its activity was measured upon treatment with CBFβ inhibitor (bottom). The CBFβ inhibitor did not increase promoter activity of the rDNAp containing a mutated RUNX site (rDNApmut). Data are presented as mean ± SD (n=3).

