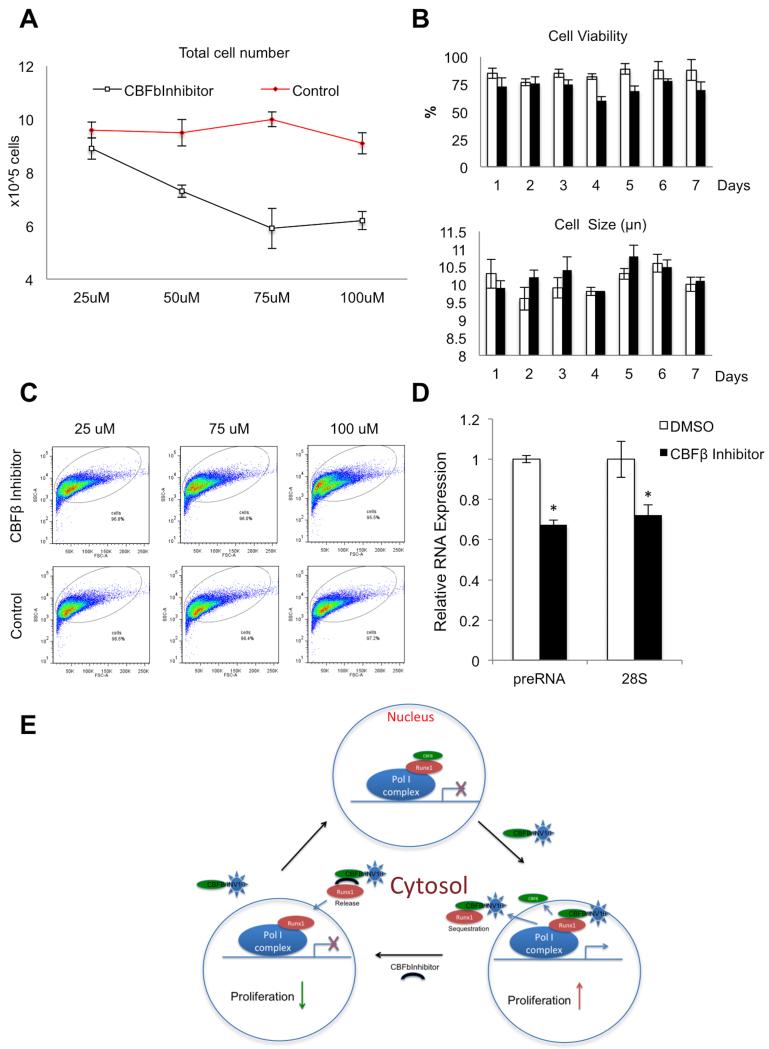
FIGURE 4. Effects of CBFβ inhibition on ribosomal gene expression and proliferation in ME-1 cells.
ME-1 cells are derived from an AML patient; they express both CBFβ and CBFβ-SMMHC proteins. A, Dose-response of CBFβ inhibitor on ME-1 cell proliferation. Cells were incubated with or without CBFβ inhibitor at different concentrations (x-axis) and cell number was counted (y-axis) after 7 days of treatment. Data are presented as mean ± SD (n=3). B, ME-1 cell viability (top graph) and cell size (lower graph) were assayed, using trypan blue assay and Countess instrument respectively, after treatment with 100 μM CBFβ inhibitor (black bars) or DMSO-only (white bars). Data are presented as mean ± SD (n=3); C, Flow cytometry was performed to detect changes in morphology of ME-1 cells treated with or without different concentrations of CBFβ inhibitor. Side versus forward scatter plots are presented. Note a shift of the ME-1 population in cells treated with the inhibitor versus control cells; D, RT-qPCR analysis in ME-1 cells suggest that relative levels of preRNA and 28S ribosomal gene transcripts were lower in cells treated with CBFβ inhibitor compared to DMSO-treated control cells (n=3, mean ± SD (*) indicates P < 0.05 ; t-test).

