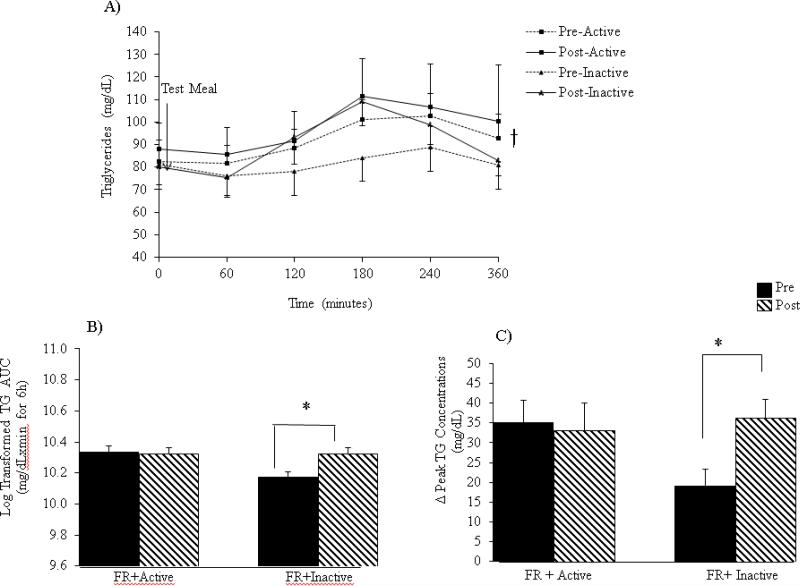
Figure 2.
(A) Postprandial effects of the test meal on triglyceride concentrations. (B) Triglyceride tAUC during the 6-hour test visits. (C) Change in triglyceride concentrations from baseline to peak levels. Data are expressed as mean ± SEM. *P< 0.05 intervention x time interaction. †P< 0.05 for main effect of meal.

