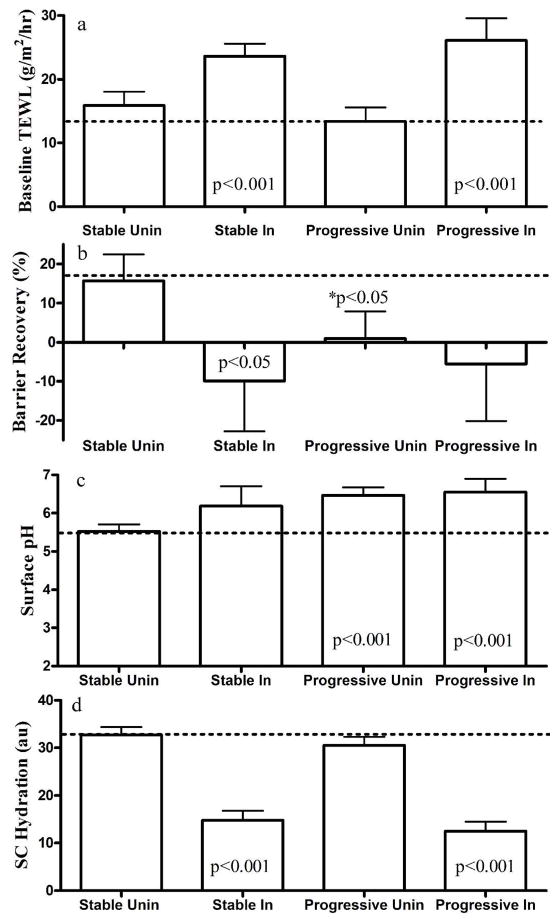
Figure 1. Comparison of SC Biophysical Properties among Normal, Involved and Uninvolved Psoriatic Skin Sites.
a & b depicts basal TEWL and barrier recovery rates, respectively. c & d presents skin surface pH and SC hydration, respectively. Results are expressed as mean ± SEM in comparison with normal skin, as shown by the horizontal dotted lines. GraphPad Prism 4 software (GraphPad Software, Inc., La Jolla, CA, USA) was used for all statistical analysis. Dunnett’s Multiple Comparison Test was used to determine the difference between normal, and psoriasis involved and uninvolved skin, except in figure 1b where the differences between normal and progressive uninvolved skin were determined with unpaired T test. P<0.05 was considered to a statistically significant difference. Significant differences are shown in the figures and numbers of subjects are detailed in Table 1.

