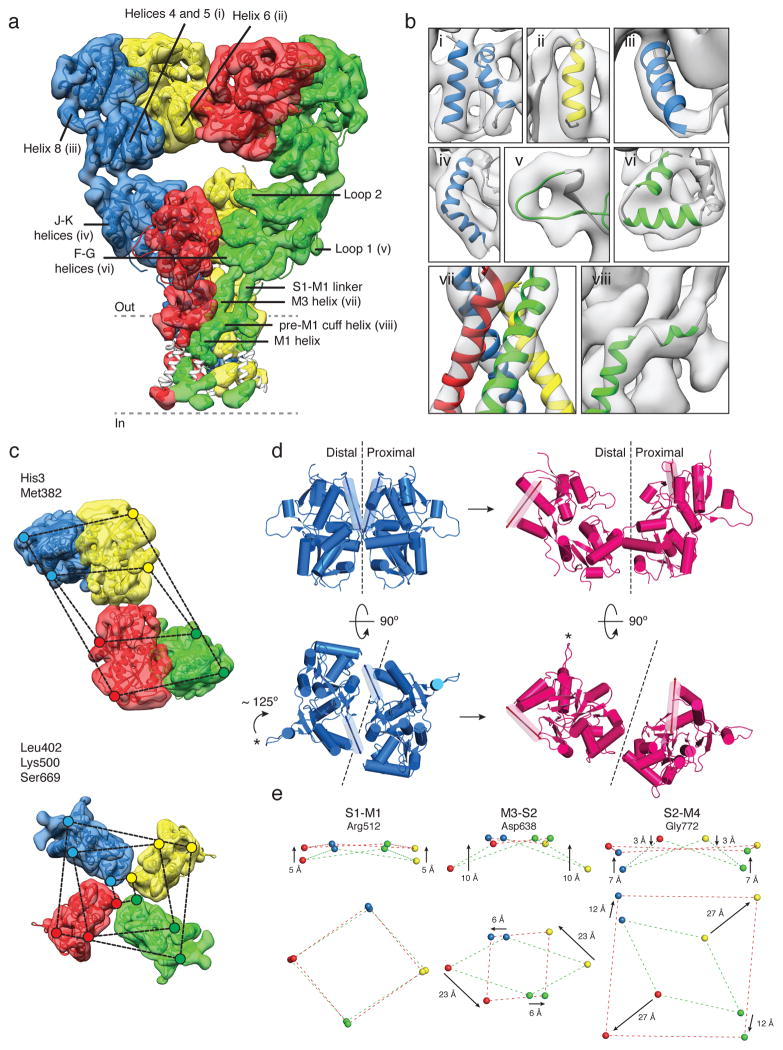
Figure 4. GluK2 receptor desensitization.
a, GluK2 desensitized state density map at ~ 7.6 Å resolution, segmented and colored to show four receptor subunits, fit with coordinates for GluK2 ATD dimers (PDB ID: 3H6G) and glutamate-bound GluK2 LBD monomers (PDB ID: 3G3F). The GluA2cryst TM domain was fit as a rigid body. Portions of TM helices where density was only weakly resolved are shown in white. b, Close-up views of selected regions of the density map labeled in (a). c, Top views of density maps for ATD (upper panel) and LBD (lower panel) layers. Colored dots connected by dashed lines identify the locations of His3 and Met382 at the top and base of the ATD, with the progressively smaller parallelograms for Leu402, Lys500 and Ser669 indicating the top, middle and base of the LBD. d, Structural changes in an LBD dimer assembly underlying the transition from the active (blue) to desensitized (magenta) states presented as side (upper panel) and top (lower panel) views. α-helix J, highlighted as a transparent cylinder, and loop 1, marked by an asterisk illustrate the magnitude of LBD rotation with desensitization. Dashed lines show the approximate location of the planar interface between subunits in the domain dimer. e, Movement of the S1-M2 linker (Arg512), M3-S2 linker (Asp638), and S2-M4 linker (Gly772) indicate how LBD tetramer movements drive channel closure; arrows show the direction of movement from active to desensitized states.

