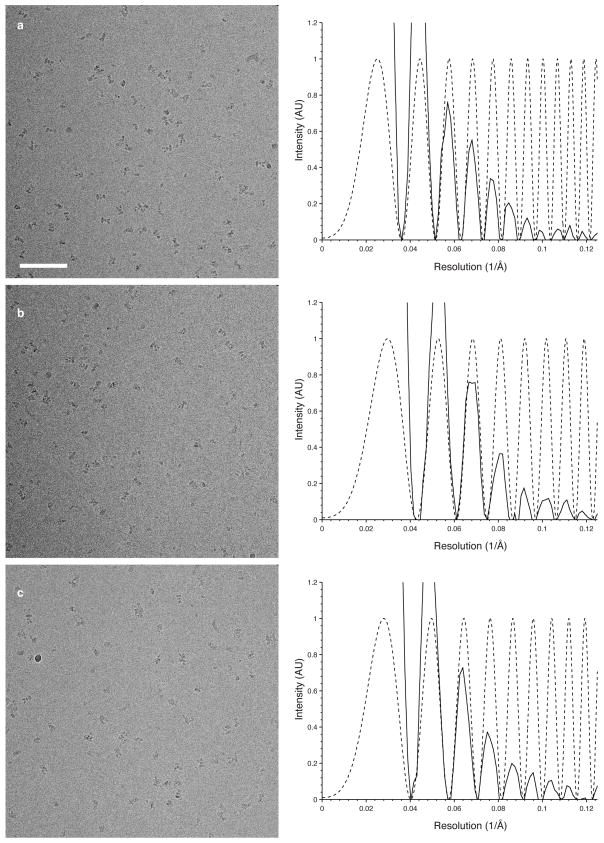
Extended Data Figure 1. Cryo-electron microscopic imaging of GluA2 with ZK200775.
a–c, A series of representative images of GluA2 bound by the competitive antagonist ZK200775 (left panels), with corresponding power spectra and CTF estimates showing signal beyond 8 Å resolution (right panels, solid and dotted lines, respectively). Defocus values are 3.7, 2.7, and 3.0 μm for the three images, respectively. Scale bar is 100 nm.

