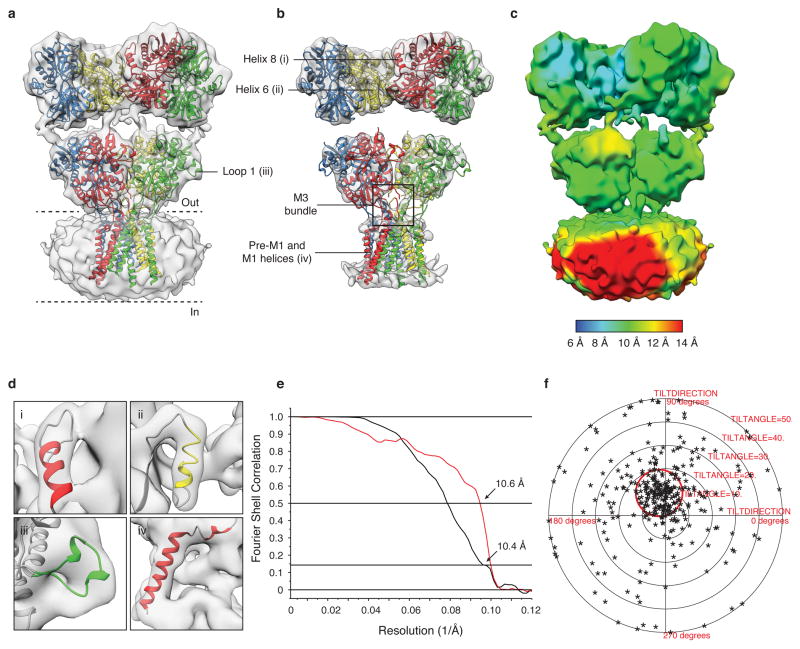
Extended Data Figure 2. Antagonist-bound closed state GluA2 density map quality and resolution.
a,b, GluA2em antagonist-bound closed state density map with coordinates for ATD dimers, LBD dimers, and the TMD tetramer independently fit to the map. All coordinates were derived from PDB ID: 3KG2. In panel (b) the density map is shown at a higher contour than (a) to highlight the closeness of fit between X-ray coordinates and the density map in the ATD and LBD layers. The density for the ATD-LBD linker region is weaker than that in the rest of the map and is therefore not visible at this threshold. The black bounding box in (b) identifies the M3-helix bundle crossing visible in the density map. c, Visualization of density map to highlight variation in resolution across different regions of the map. The estimated resolution value is color-coded using the scale shown at the bottom edge of the panel. d, Expanded versions of selected regions of map. Roman numerals identify helices 6 and 8, loop 1, and the pre-M1 and M1 helices as indicated in panels (a) and (b). e, A set of plots that include gold-standard FSC plot (black line) for the GluA2em antagonist-bound closed state density map showing a resolution of 10.4 Å at an FSC value of 0.143, and a plot (red line) of the FSC between the experimentally obtained cryo-EM density map and a map computed from the fitted coordinates, which displays a resolution of 10.6 Å at an FSC value of 0.5, consistent with the gold-standard FSC curve. f, Validation of density map using tilt-pair parameter plot. The spread in orientational assignments around the known goniometer settings is within ~ 25° for > 80 % of the selected particle pairs, with clear clustering observed at the expected location, centered at a distance of 10° from the origin.

