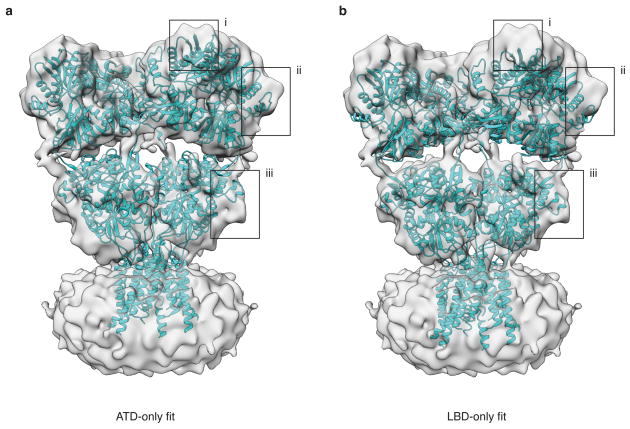
Extended Data Figure 3. Assessment of correspondence between GluA2em and GluA2cryst.
a,b, Density map of antagonist-bound closed state GluA2em with rigid body fits of GluA2cryst (PDB ID: 3KG2) reveals separation between the ATD and LBD layers in GluA2em that is absent in GluA2cryst due to deletion of six residues in the ATD-LBD linker. In (a), GluA2cryst fitting was performed using only ATD tetramer coordinates, which reveals a good fit of the ATD layer, but at the expense of a loss of fit of the LBD assembly. Conversely, in (b) fitting was performed using only LBD tetramer coordinates, which reveals a good fit of the LBD layer, but at the expense of a loss of fit of the ATD assembly. The black boxes highlight examples of regions where the mismatches are clearly evident.

